
March 30, 2023
The Inflation Reduction Act (IRA) was signed into law in August, 2022 and is considered the single largest action that the U.S. government has ever taken to address climate change. According to the U.S. Office of Management and Budget (OMB), the law is projected to help reduce U.S. carbon pollution by about 40% by 2030 compared to 2005 levels, and will move the U.S. much closer to its target as part of the Paris Climate Agreement (at least a 43% reduction by 2030).
The Inflation Reduction Act (IRA) is designed to curb inflation and offers several economic and public health co-benefits including decreasing the federal deficit, reducing the cost of health insurance and prescription drugs, and investing $386 billion in developing clean energy in the U.S. For example, the law includes several tax incentives and rebates for buying energy efficient technologies (e.g., heat pumps, solar panels, electric vehicles), funding for clean energy jobs and training programs, and increased investments in climate justice priorities and the communities that are most harmed by environmental issues (e.g., reducing pollution, improving clean transit, and making clean energy affordable and accessible).
However, many Americans have not heard much about the Inflation Reduction Act (IRA). In our most recent Politics & Policy report, most registered voters (57%) say they have heard either “a little” (24%) or “nothing at all” (33%) about it. After learning about the IRA, however, most registered voters (68%) say they support it.
To fully achieve the goals of the Inflation Reduction Act (IRA), it will be critical to raise public awareness of the IRA’s potential benefits (e.g., incentives for clean energy technologies and household electrification) and to promote public engagement and support.
Here, we use data from our latest Climate Change in the American Mind survey data (December, 2022; n = 1,085 including 938 registered voters) to identify the groups who are the least familiar with the Inflation Reduction Act (IRA) and are most supportive of it after learning about it. Due to sample size limitations among racial/ethnic groups, we can only compare the three largest racial/ethnic groups in the U.S.: White (non-Hispanic/Latino), Black (non-Hispanic/Latino), and Hispanic/Latino adults. Importantly, due to small sample sizes, the average margins of error at the 95% confidence interval for Black (+/- 9.3 percentage points) and Hispanic/Latino (+/- 8.5 percentage points) respondents are larger than for other groups, and thus results should be interpreted with some degree of caution.
Results
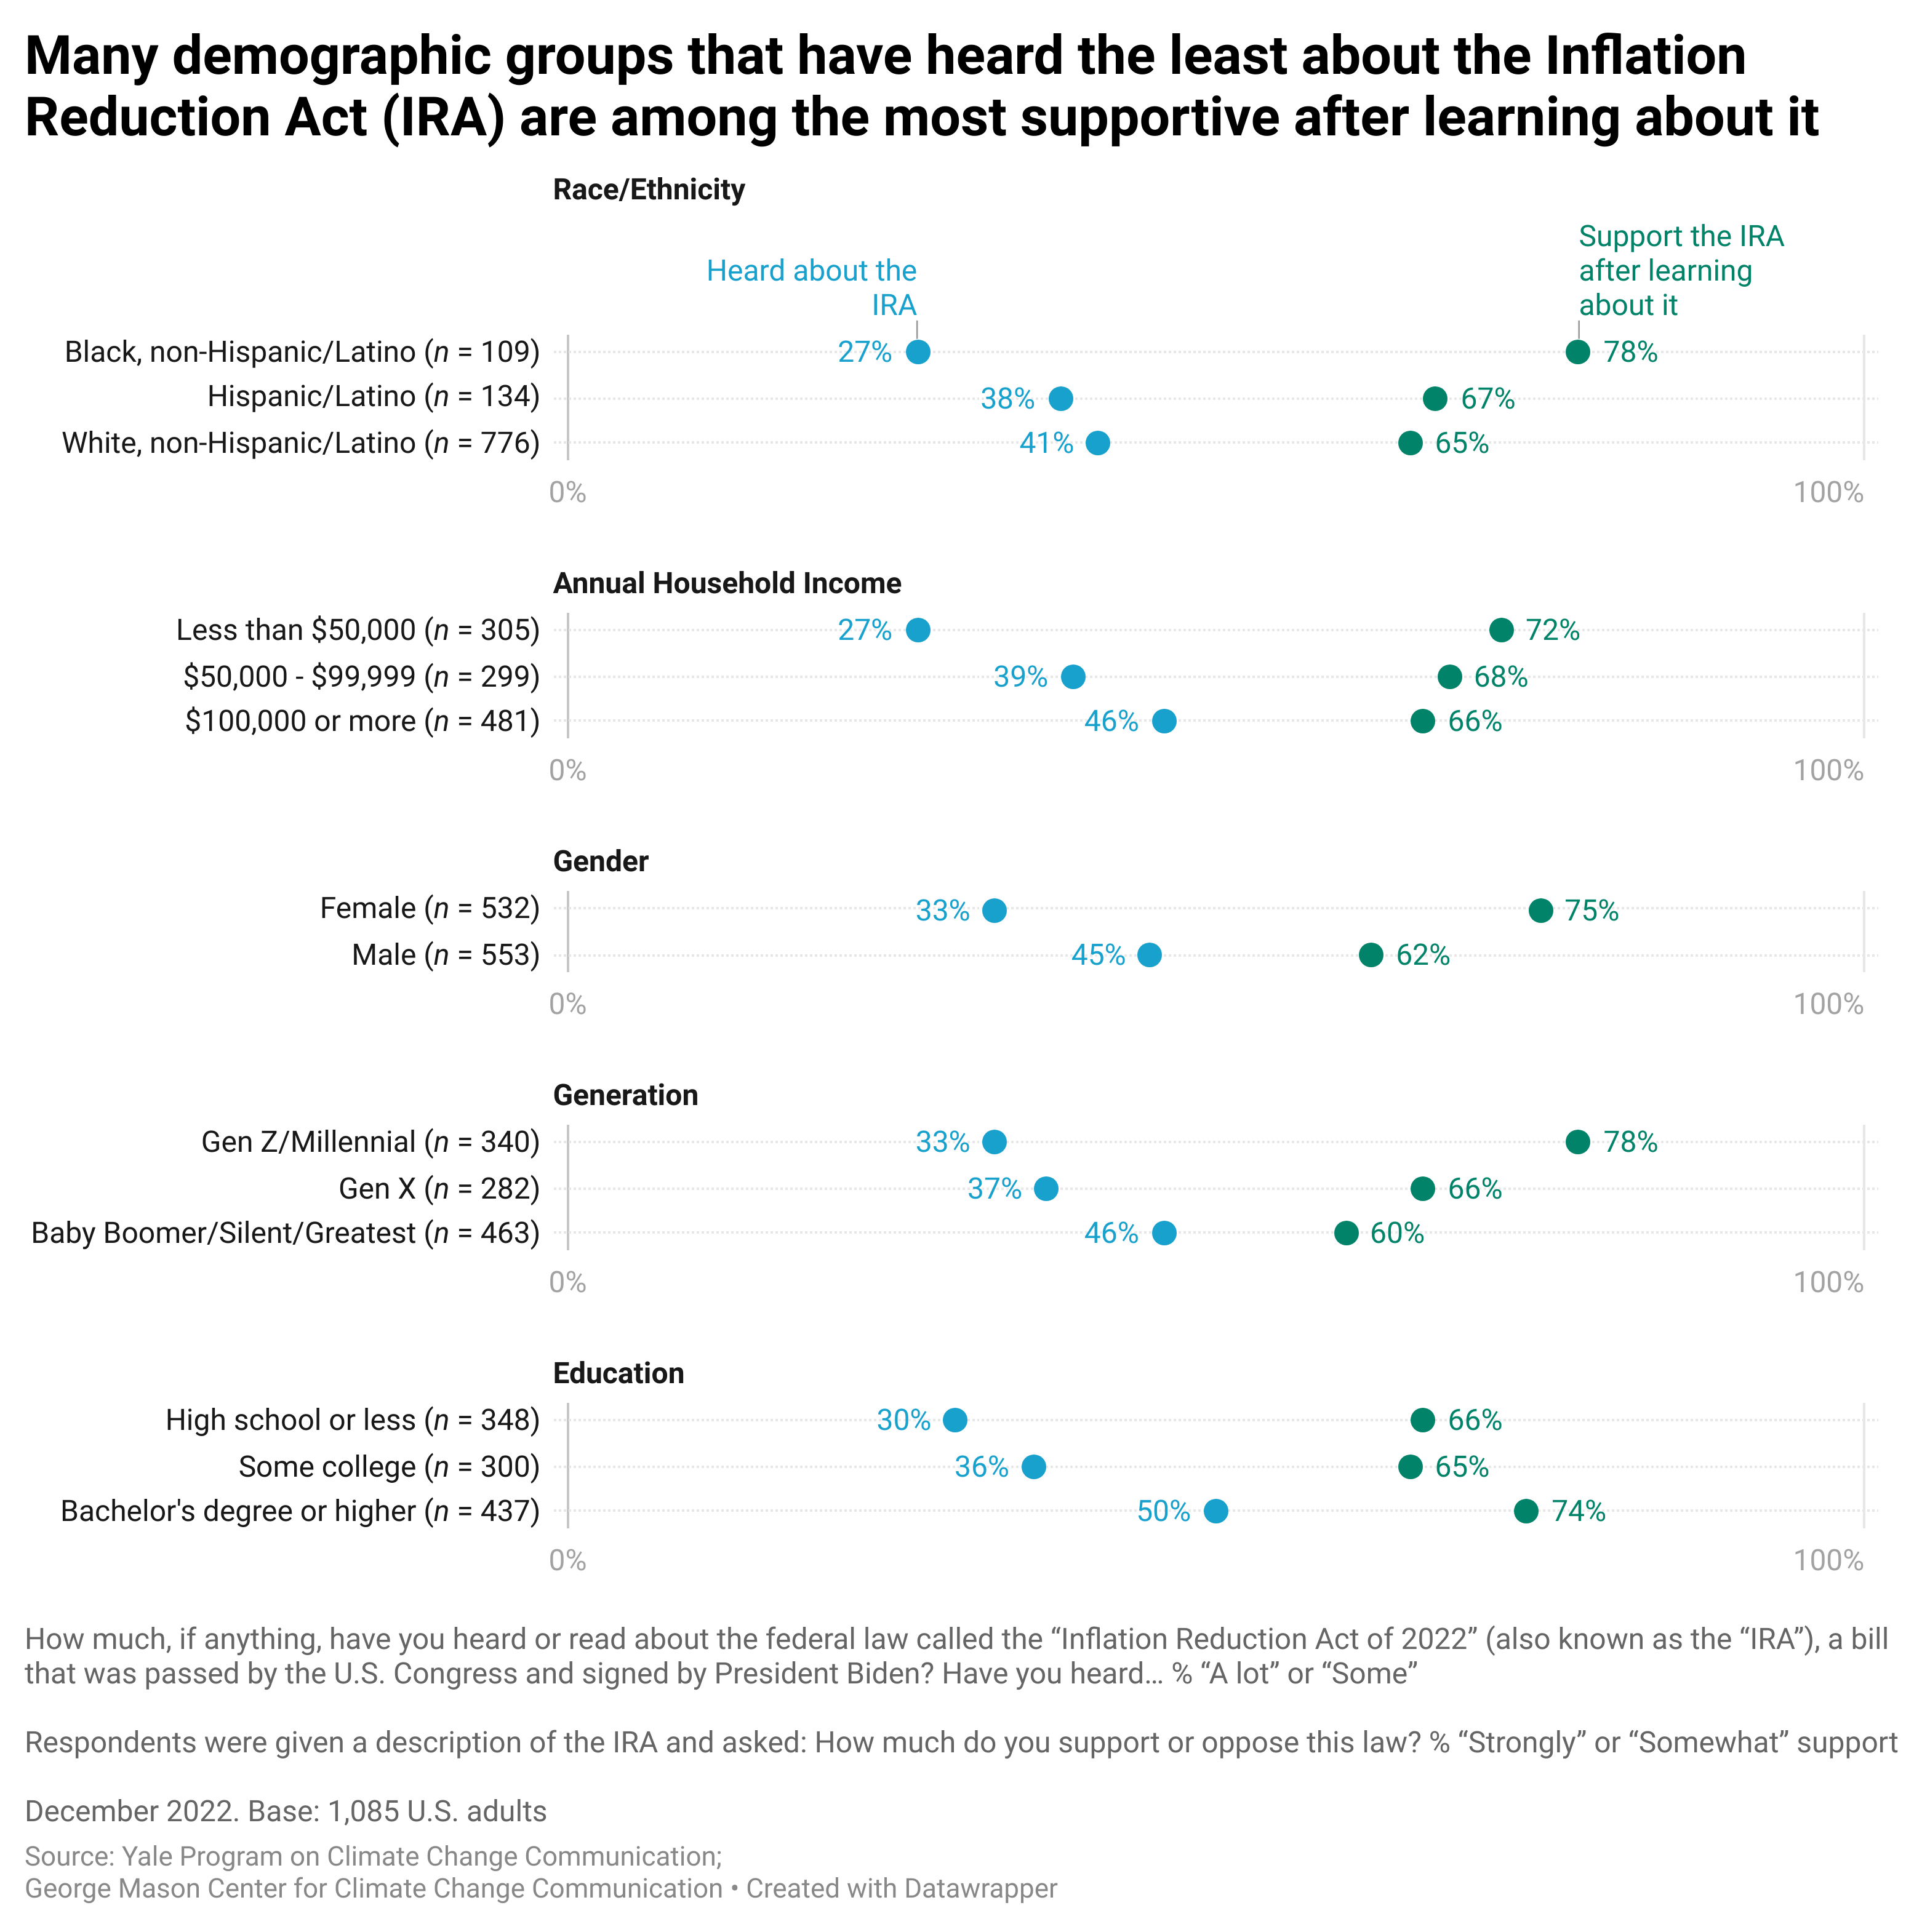
Respondents were first asked how much they have heard or read about the Inflation Reduction Act (IRA) of 2022. After responding to that initial question, respondents were given a brief description of the IRA and then asked how much they support or oppose the law (see Methods section for details [FN text: visit the Climate Note on our website for details]). The demographic groups least likely to say they have heard “a lot” or “some” about the IRA include Black Americans (27%), people who earn less than $50,000 annually (27%), women (33%), Gen Z/Millennials (33%), and those with a high school education or less (30%).
These same demographic groups (except those with a high school education or less) are among the groups most likely to “strongly” or “somewhat” support the IRA after reading a description about it: Black Americans (78%), people who earn less than $50,000 annually (72%), women (75%), and Gen Z/Millennials (78%). The smallest differences in IRA support are among income groups: people who earn less than $50,000 per year are only marginally more likely to support the IRA than those who earn $100,000 or more.
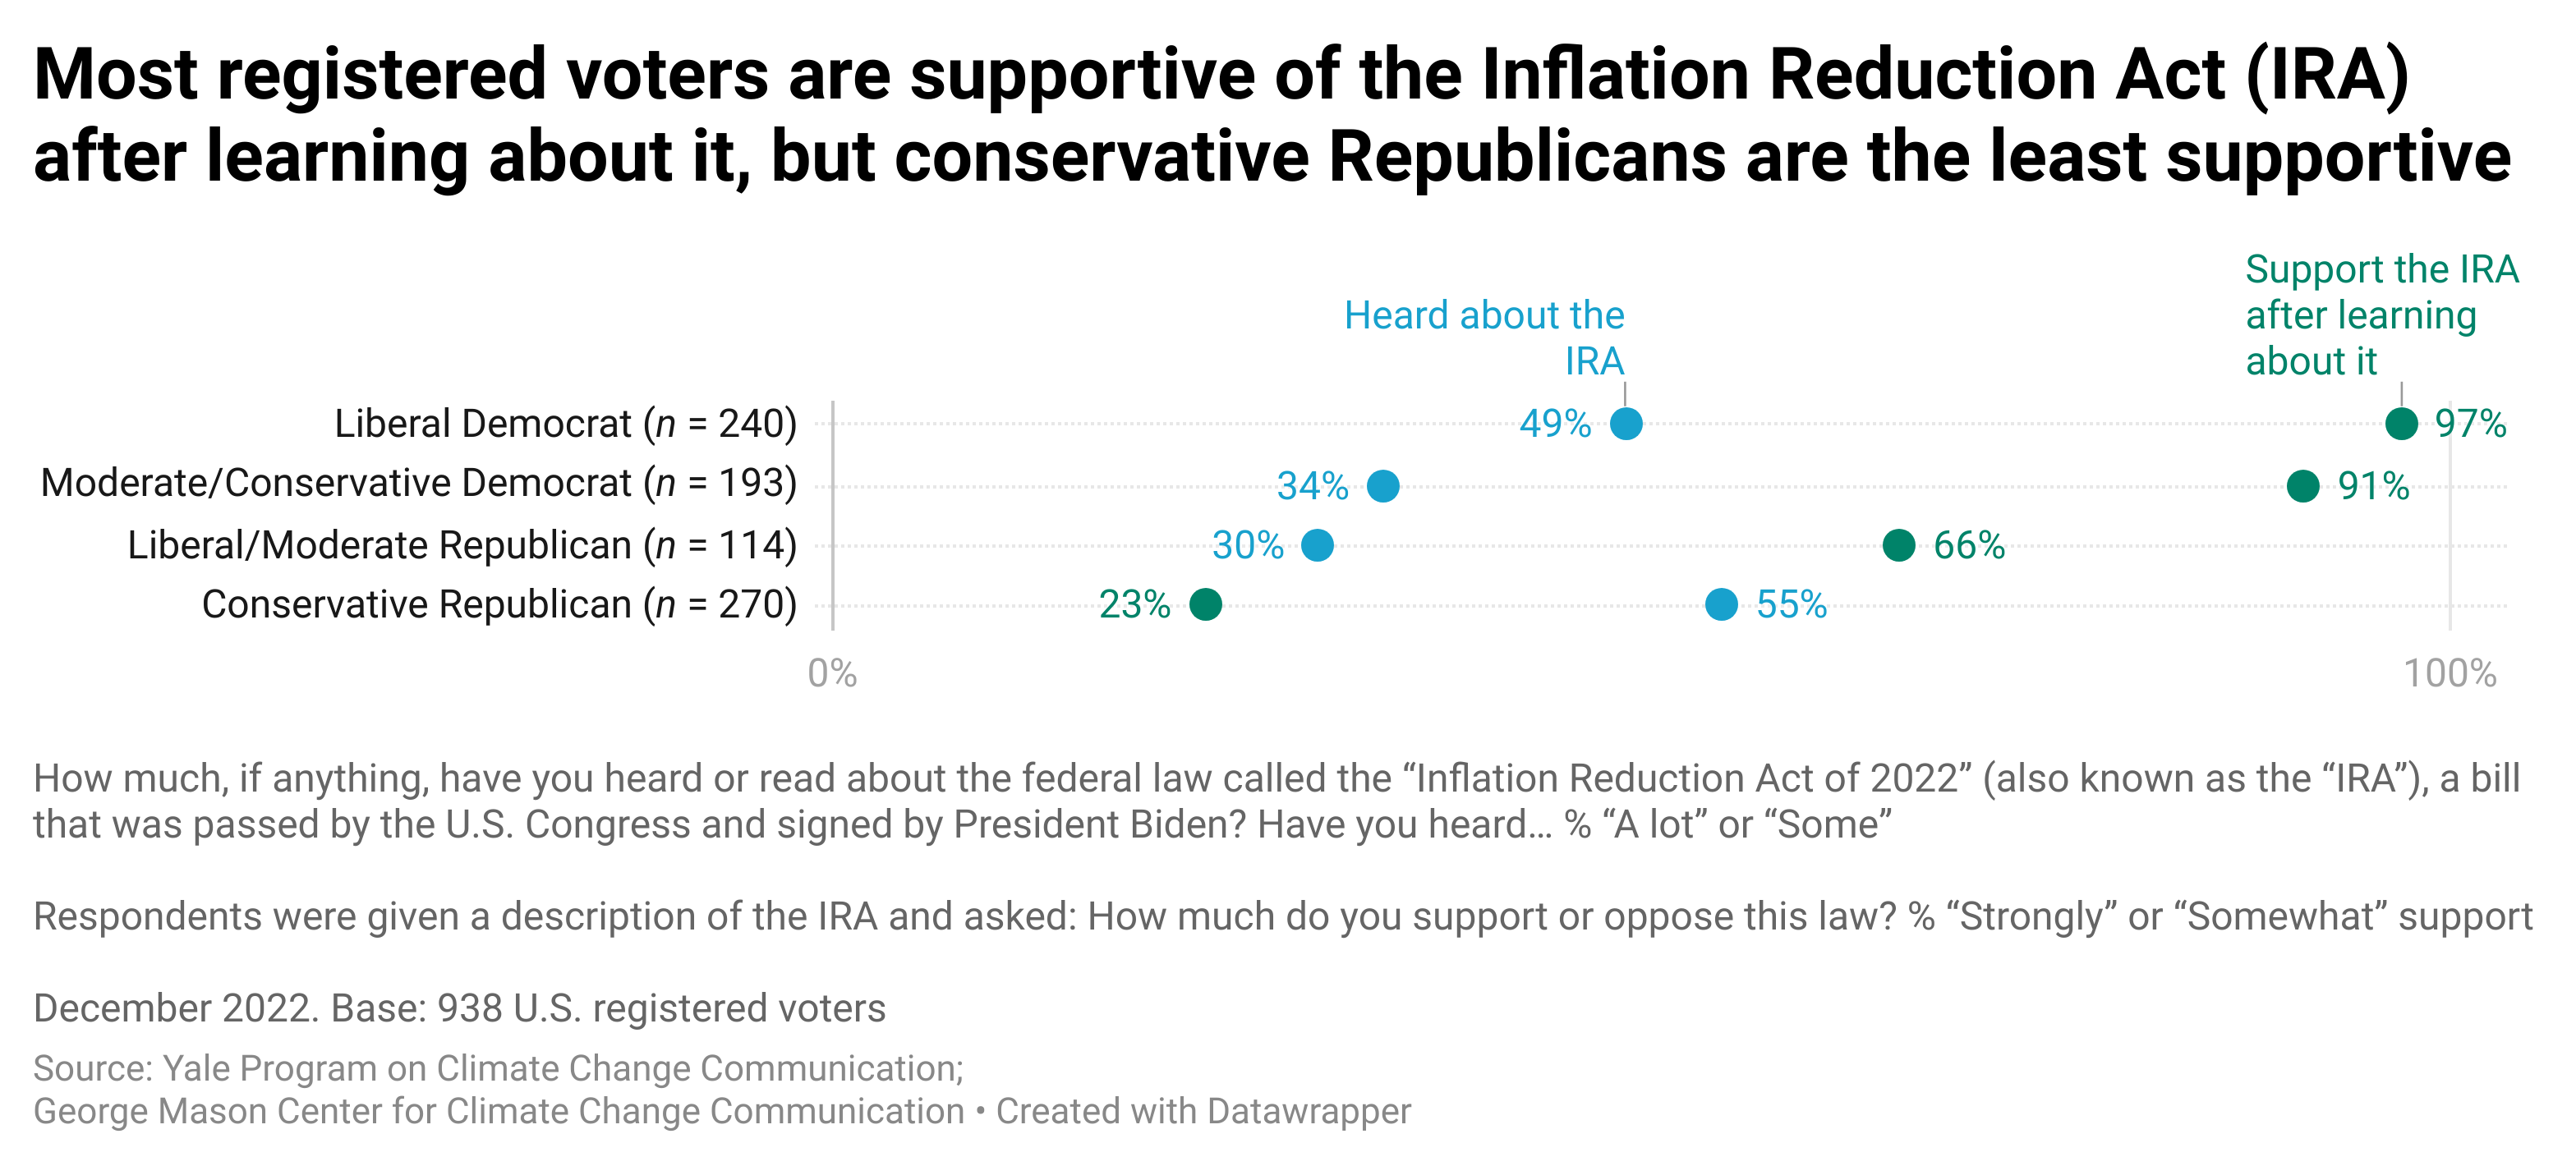
Among registered voters, liberal Democrats (49%) and conservative Republicans (55%) are the most likely to say they have heard “a lot” or “some” about the Inflation Reduction Act (IRA), while moderate/conservative Democrats (34%) and liberal/moderate Republicans (30%) are the least likely to say so. After reading a description of the IRA, however, majorities of moderate/conservative Democrats (91%) and liberal/moderate Republicans (66%) say they “strongly” or “somewhat” support the IRA – as do nearly all liberal Democrats (97%). In contrast, while many conservative Republicans have heard about the IRA, they are the least likely (23%) to support the law after reading a description about it.
These results indicate that most members of several groups in the United States (e.g., Black Americans, people in lower-income households, women, younger adults, political moderates) have not heard much about the Inflation Reduction Act (IRA), but majorities in these groups support the act when informed about its goals. This suggests that members of these groups may especially benefit from communications that promote awareness of the IRA.
Understanding opinions about the IRA among people in lower-income households and people of color is particularly important. The IRA will prioritize investment in low-income communities and communities of color – including Black, Indigenous, Hispanic/Latino, Asian American, and Pacific Islander communities – who are disproportionately affected by climate change and environmental hazards (e.g., extreme weather events, air and water pollution). Low-income communities and communities of color are often identified as frontline communities (groups that are most at risk and experience the “first and worst” climate impacts), and fenceline communities (groups adjacent to high-polluting facilities like fossil fuel refineries and factories).
Taken together, these findings point to an opportunity for communicators to promote public awareness of and engagement with the Inflation Reduction Act (IRA), and for organizers to work closely with the communities that will receive support from the IRA.
Methods
The results of this report are based on data from the December 2022 wave (n = 1,085, including 938 registered voters) of the twice-yearly Climate Change in the American Mind survey – a nationally representative survey of U.S. public opinion on climate change conducted by the Yale Program on Climate Change Communication and the George Mason University Center for Climate Change Communication. Data were collected from December 2 – 12, 2022 using the Ipsos KnowledgePanel®, a representative online panel of U.S. adults ages 18 and older. Questionnaires were self-administered online in a web-based environment.
To assess support for the Inflation Reduction Act, respondents were provided with the following: “The Inflation Reduction Act of 2022 (IRA) aims to curb inflation by reducing the federal deficit, lowering prescription drug prices and the cost of health insurance, modernizing the Internal Revenue Service, and investing in U.S. clean energy production. The law authorizes $391 billion for developing clean energy and addressing global warming, including tax incentives and rebates to help consumers and businesses buy energy-efficient appliances, solar panels, electric vehicles, etc. The IRA also includes support for clean energy jobs and investments in communities that are most harmed by air and water pollution. It is the largest investment the U.S. government has ever made to reduce global warming, and is projected to help the U.S. reduce its carbon pollution 40% by 2030. The law will be paid for by closing tax loopholes. How much do you support or oppose this law? Strongly support, somewhat support, somewhat oppose, strongly oppose.”
Data were weighted to align with demographic parameters in the United States. Following Pew Research Center’s approach, generational cohort and year of birth were calculated based on the age of respondents at the time of data collection (Gen Z: 1997-2012; Millennial: 1981-1996; Gen X: 1965-1980; Baby Boomer: 1946-1964; Silent Generation: 1928-1945; and Greatest Generation: before 1928). Because generational cohort classification was based on respondents’ age at the time they took the survey (rather than birth year, which was not known), some respondents on the cusp of two generations may be miscategorized.
Among the subset of registered voters, references to Republicans and Democrats throughout include respondents who initially identify as either a Republican or Democrat, as well as those who do not initially identify as a Republican or Democrat but who say they “are closer to” one of those parties (i.e., “leaners”) in a follow-up question. The category “Independents” does not include any of these “leaners.” Independents and respondents who do not identify with a party or are not interested in politics are not included in this report.
In figures/data tables, bases specified are unweighted, while percentages are weighted to match national population parameters. For tabulation purposes, percentage points are rounded to the nearest whole number. The data tables used to develop the charts/figures can be found here.
Group differences were tested for statistical significance using the weighted proportions and unweighted sample sizes of each group. The average margin of error is +/- 3 percentage points at the 95% confidence interval for the full sample of U.S. adults (n = 1,085) and +/- 3.2 percentage points for the subset of registered voters who participated in the survey (n = 938). Margins of error at the 95% confidence interval for the subgroups are:
- Black (non-Hispanic/Latino) +/- 9.4 percentage points (n = 109)
- Hispanic/Latino +/- 8.5 percentage points (n = 134)
- White (non-Hispanic/Latino) +/- 3.5 percentage points (n = 776)
- Earn less than $50,000 annually +/- 5.6 percentage points (n = 305)
- Earn $50,000-$99,999 annually +/- 5.7 percentage points (n = 299)
- Earn $100,000 or more annually +/- 4.5 percentage points (n = 481)
- Women +/- 4.2 percentage points (n = 532)
- Men +/- 4.2 percentage points (n = 553)
- Gen Z/Millennial +/- 5.3 percentage points (n = 340)
- Gen X +/- 5.8 percentage points (n = 282)
- Baby Boomer/Silent/Greatest +/- 4.6 percentage points (n = 463)
- High school or less education +/- 5.3 percentage points (n = 348)
- Some college +/- 5.7 percentage points (n = 300)
- Bachelor’s degree or higher +/- 4.7 percentage points (n = 437)
- Liberal Democrat +/- 6.3 percentage points (n = 240)
- Moderate/conservative Democrat +/- 7.1 percentage points (n = 193)
- Liberal/moderate Republican +/- 9.2 percentage points (n = 114)
- Conservative Republican +/- 6.0 percentage points (n = 270)
Climate Change in the American Mind is conducted jointly by the Yale Program on Climate Change Communication and the George Mason University Center for Climate Change Communication.
Citation
Ballew, M., Verner, M., Rosenthal, S., Maibach, E., Kotcher, J., & Leiserowitz, A. (2023). Who is most supportive of the Inflation Reduction Act? Yale University and George Mason University. New Haven, CT: Yale Program on Climate Change Communication.
Funding Sources
The research was funded by the 11th Hour Project, the Energy Foundation, the MacArthur Foundation, the Heising-Simons Foundation, and the Grantham Foundation