

Report Summary
This report is based on findings from a nationally representative survey – Climate Change in the American Mind – conducted jointly by the Yale Program on Climate Change Communication and the George Mason University Center for Climate Change Communication. Interview dates: October 20 – 26, 2023. Interviews: 1,033 adults (18+), 906 of whom are registered to vote. Average margin of error for registered voters: +/- 3 percentage points at the 95% confidence level.
Climate Change in the American Mind is conducted jointly by the Yale Program on Climate Change Communication and the George Mason University Center for Climate Change Communication.
Principal Investigators:
Anthony Leiserowitz, PhD
Yale Program on Climate Change Communication
Edward Maibach, MPH, PhD
George Mason University Center for Climate Change Communication
Seth Rosenthal, PhD
Yale Program on Climate Change Communication
John Kotcher, PhD
George Mason University Center for Climate Change Communication
For all media and other inquiries, please email:
Yale Program on Climate Change Communication: Lisa Fernandez ([email protected]), Eric Fine ([email protected]), and Michaela Hobbs ([email protected])
George Mason University Center for Climate Change Communication: Edward Maibach ([email protected]) and John Kotcher ([email protected])
Reading Notes
- This report includes only registered voters.
- References to Republicans and Democrats throughout include respondents who initially identify as either a Republican or Democrat, as well as those who do not initially identify as a Republican or Democrat but who say they “are closer to” one of those parties (i.e., “leaners”) in a follow-up question. The category “Independents” does not include any of these “leaners.”
- For tabulation purposes, percentage points are rounded to the nearest whole number. As a result, percentages in a given chart may total slightly higher or lower than 100%. Summed response categories (e.g., “strongly support” + “somewhat support”) are rounded after sums are calculated. For example, in some cases, the sum of 25% + 25% might be reported as 51% (e.g., 25.3% + 25.3% = 50.6%, which, after rounding, is 51%).
- Weighted percentages among registered voters of each of the groups discussed in this report:
- Democrats (total) including leaners: 44%
- Liberal Democrats: 26%
- Moderate/Conservative Democrats: 18%
- (Moderate Democrats: 17%; Conservative Democrats: 1%)
- Republicans (total) including leaners: 39%
- Liberal/Moderate Republicans: 13%
- (Liberal Republicans: 1%; Moderate Republicans: 11%)
- Conservative Republicans: 26%
- Liberal/Moderate Republicans: 13%
- Democrats (total) including leaners: 44%
- Independents excluding leaners: 13% (included the in results reported for “All Registered Voters” only)
- No party/Not interested in politics/No response: 5% (included in the results reported for “All Registered Voters” only)
- The full text of all survey items can be found in the data tables.
Executive Summary
Drawing on a representative sample of the U.S. adult population (n = 1,033; including the 906 registered voters whose data are included in this report), these findings describe how registered voters view a variety of domestic climate and energy policies. The survey was fielded from October 20 – 26, 2023.
This executive summary mostly presents the results for all registered voters only, while the main text of the report also breaks the results down by political party and ideology.
Global Warming as a Voting Issue
- 57% of registered voters would prefer to vote for a candidate for public office who supports action on global warming. This includes 95% of liberal Democrats, 86% of moderate/conservative Democrats, and 46% of liberal/moderate Republicans, but only 13% of conservative Republicans.
Global Warming and Clean Energy as Government Priorities
- 56% of registered voters think global warming should be a high or very high priority for the president and Congress.
- 64% of registered voters think developing sources of clean energy should be a high or very high priority for the president and Congress.
Policies to Reduce the Pollution that Causes Global Warming
Majorities of registered voters support a range of policies to reduce carbon pollution and promote clean energy. These include:
- 85% support federal funding to help farmers improve practices to protect and restore the soil so it absorbs and stores more carbon.
- 72% support tax rebates to people who purchase energy-efficient vehicles or solar panels.
- 71% support tax credits or rebates to encourage people to buy electric appliances, such as heat pumps and induction stoves, that run on electricity instead of oil or gas.
- 66% support requiring fossil fuel companies to pay a tax on the carbon they produce and using the money to reduce other taxes by an equal amount.
- 64% support transitioning the U.S. economy from fossil fuels to 100% clean energy by 2050.
- 63% support requiring electric utilities to produce 100% of their electricity from renewable energy sources by 2035.
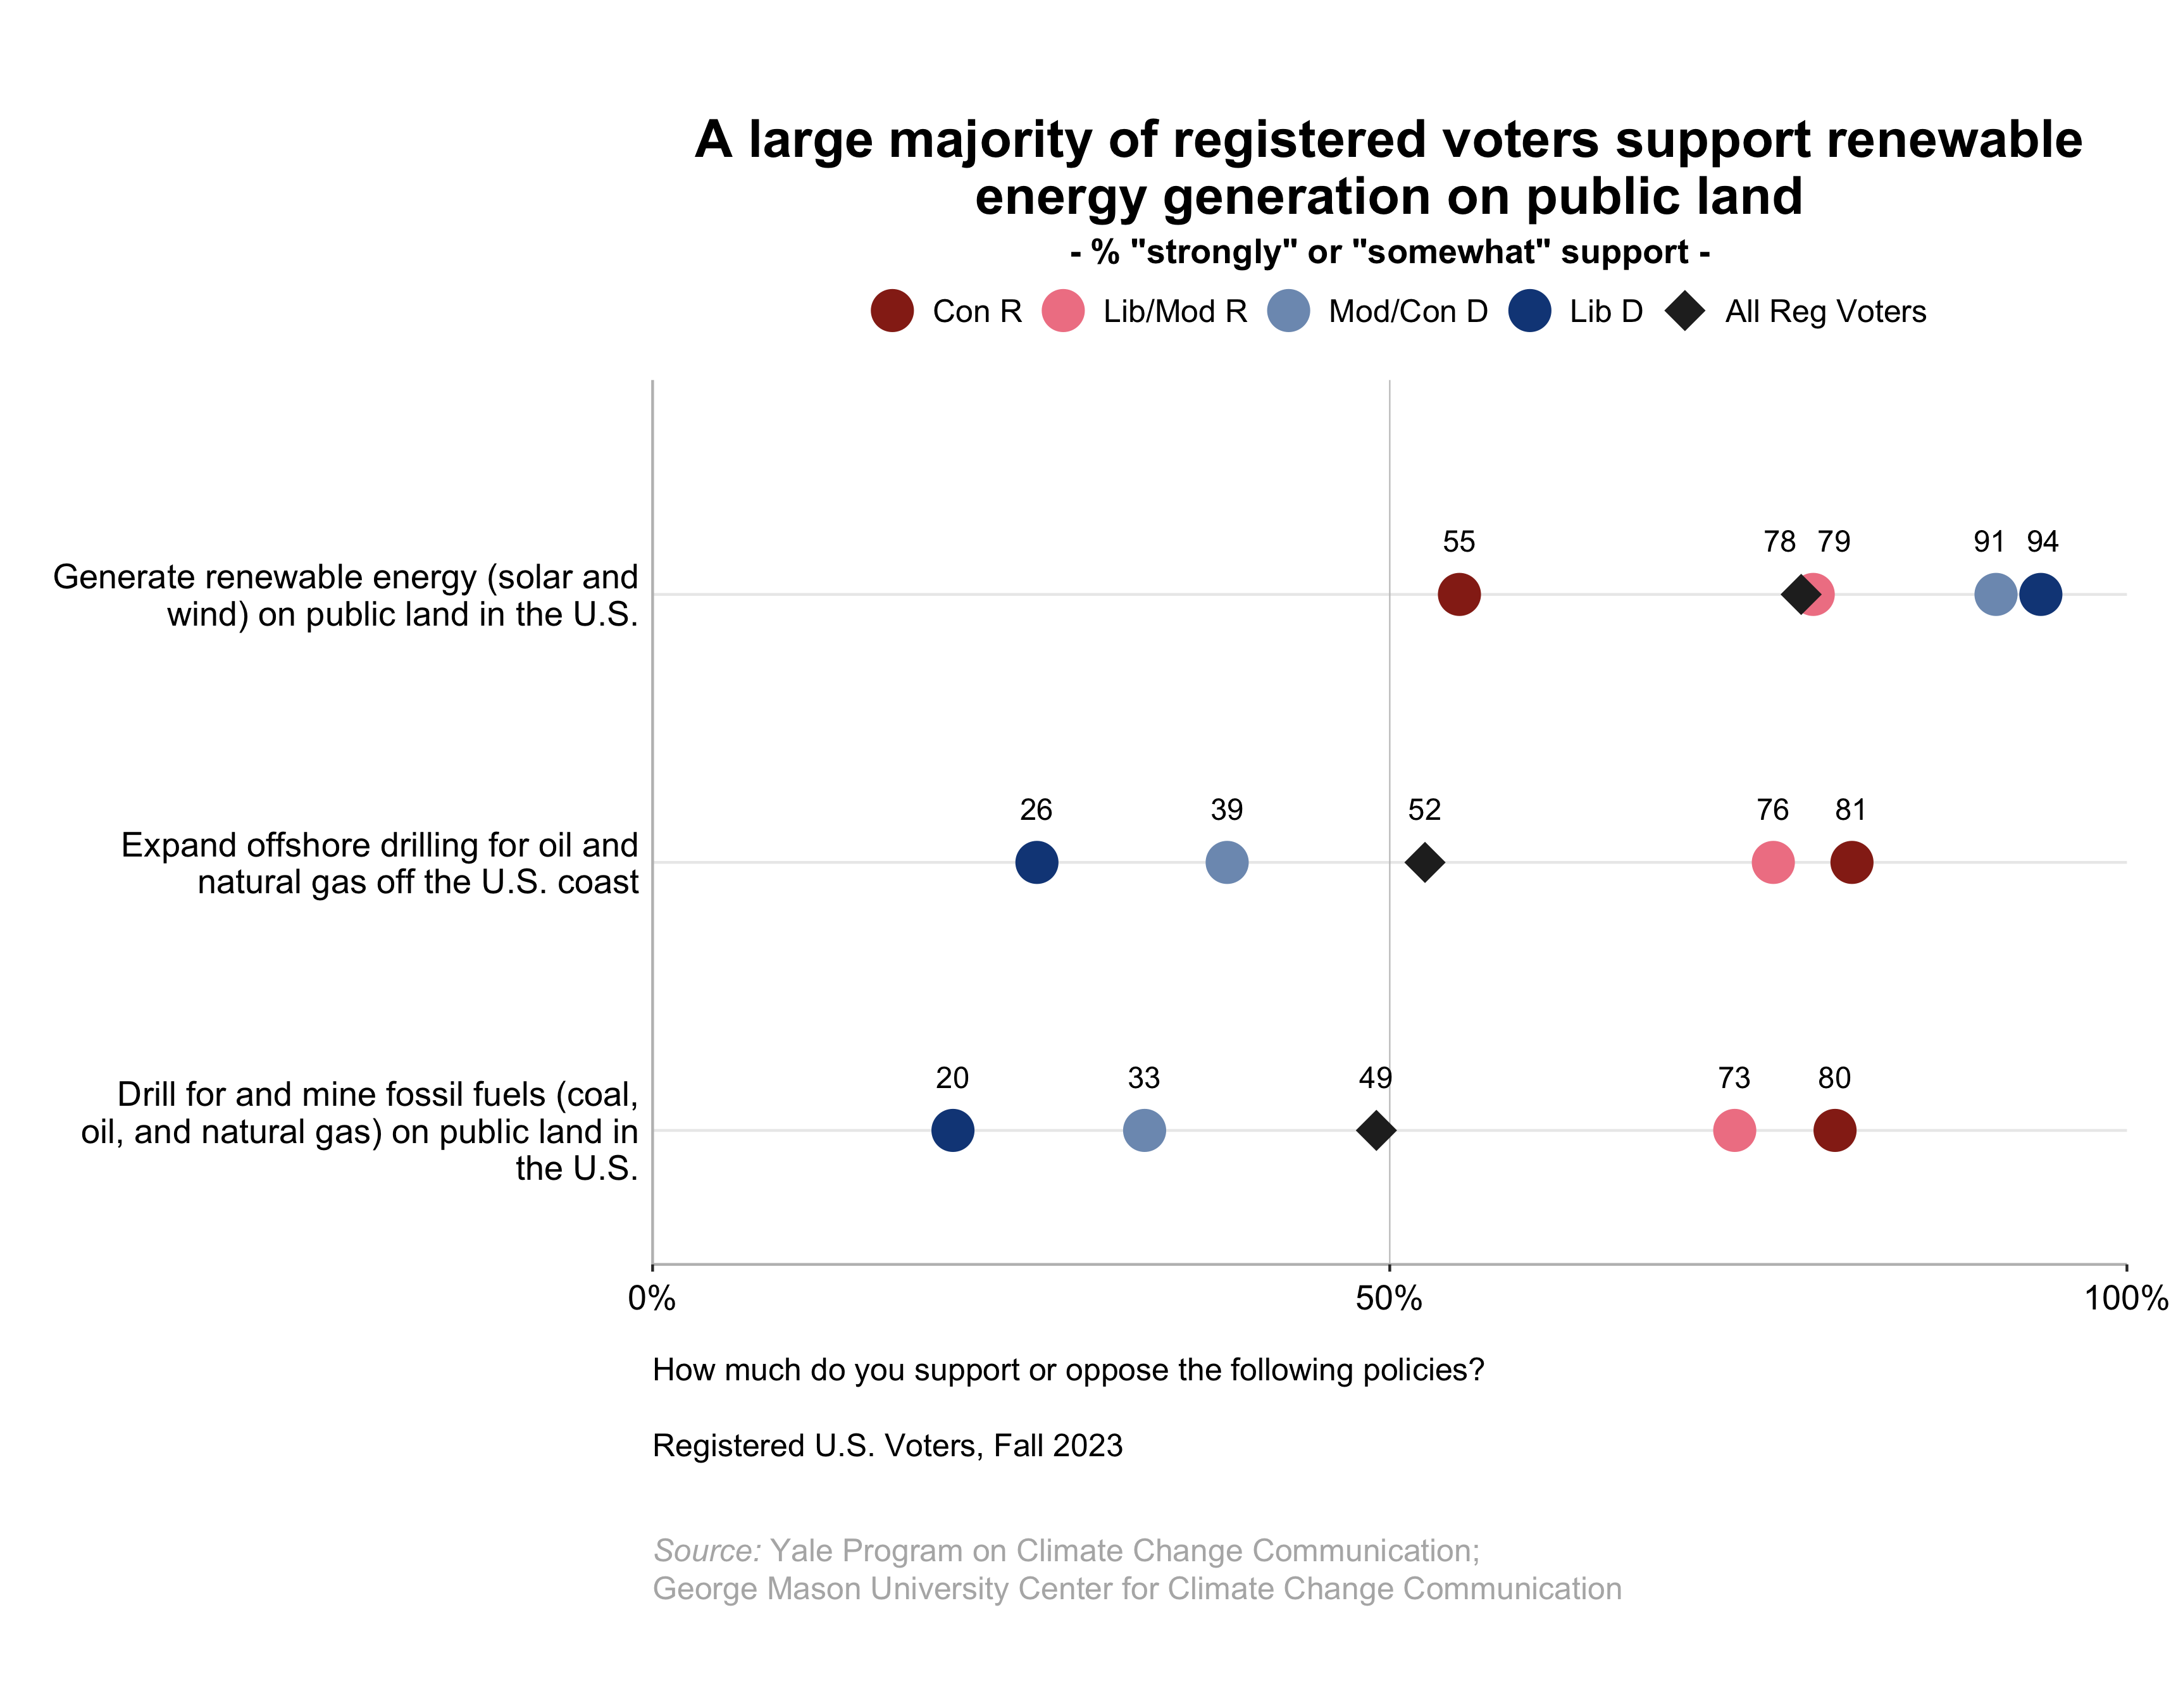
Energy Production
- 78% of registered voters support generating renewable energy on public land in the U.S.
- 52% support expanding offshore drilling for oil and natural gas off the U.S. coast.
- 49% support drilling and mining fossil fuels on public land in the U.S.
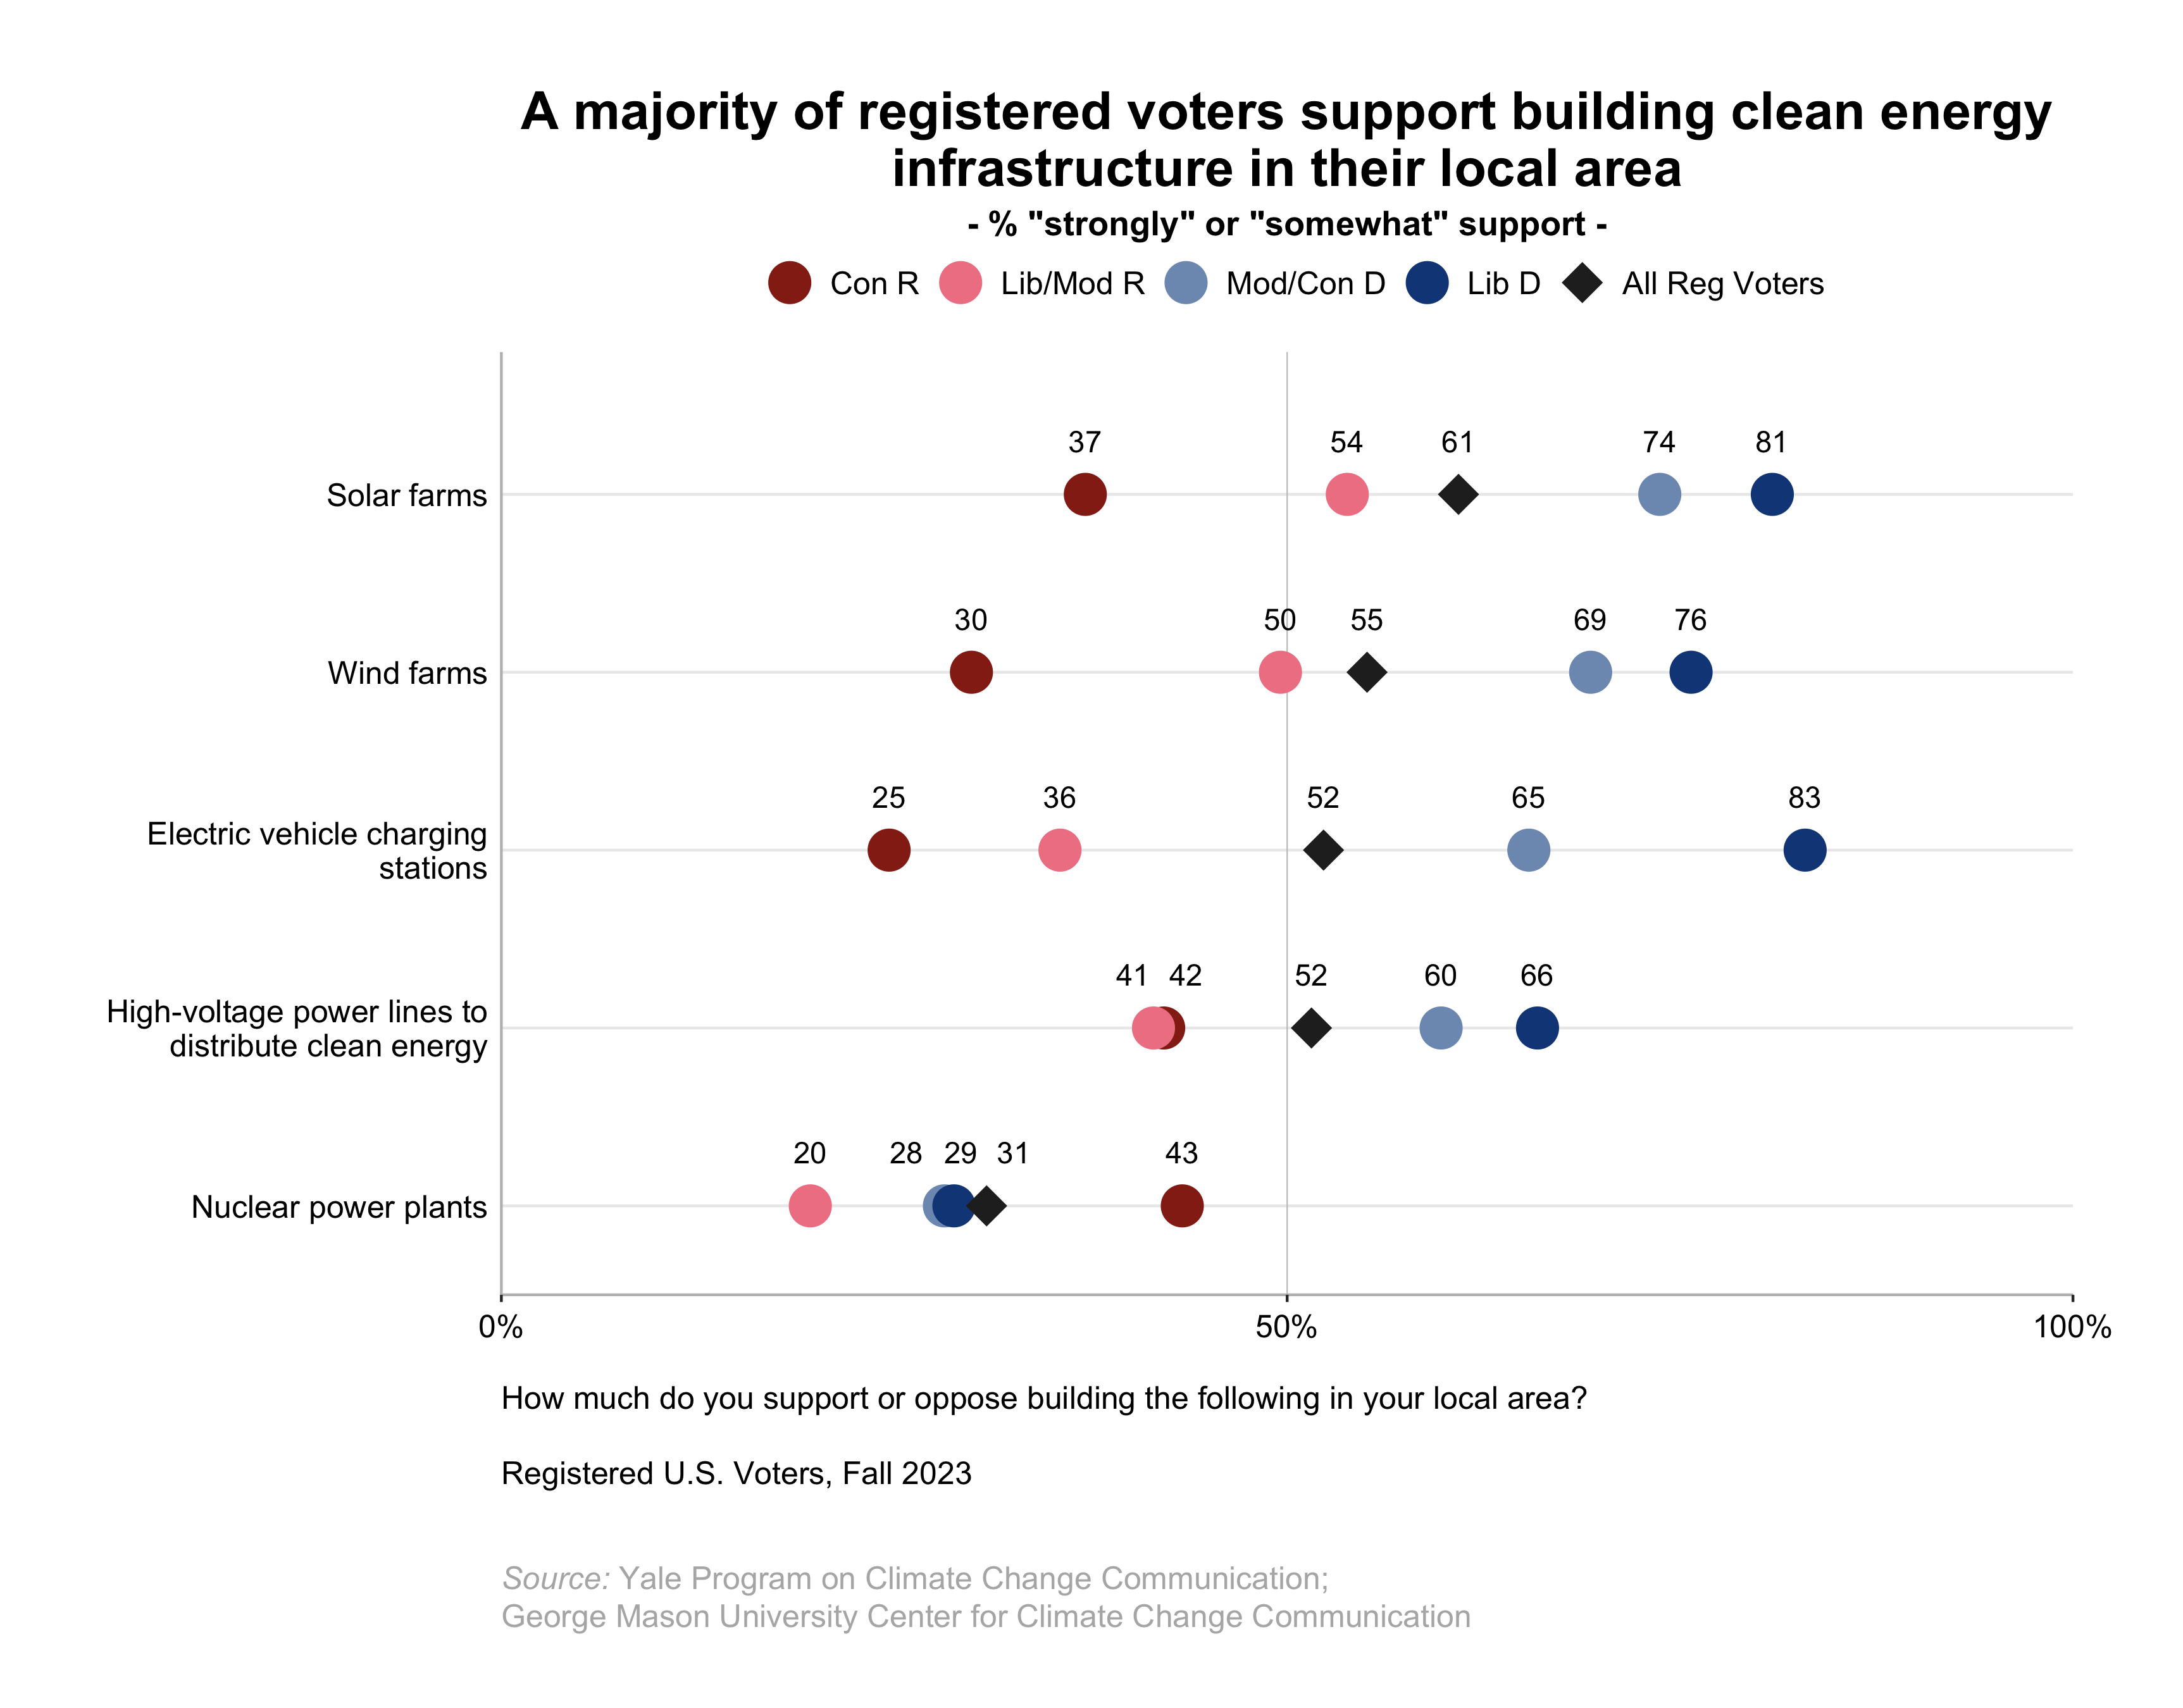
Building Climate-Friendly Energy Production and Distribution Infrastructure
Many registered voters support building clean energy infrastructure in their local area. This includes:
- Solar farms: 61%
- Wind farms: 55%
- Electric vehicle charging stations: 52%
- High-voltage power lines to distribute clean energy: 52%
- Nuclear power plants: 31%
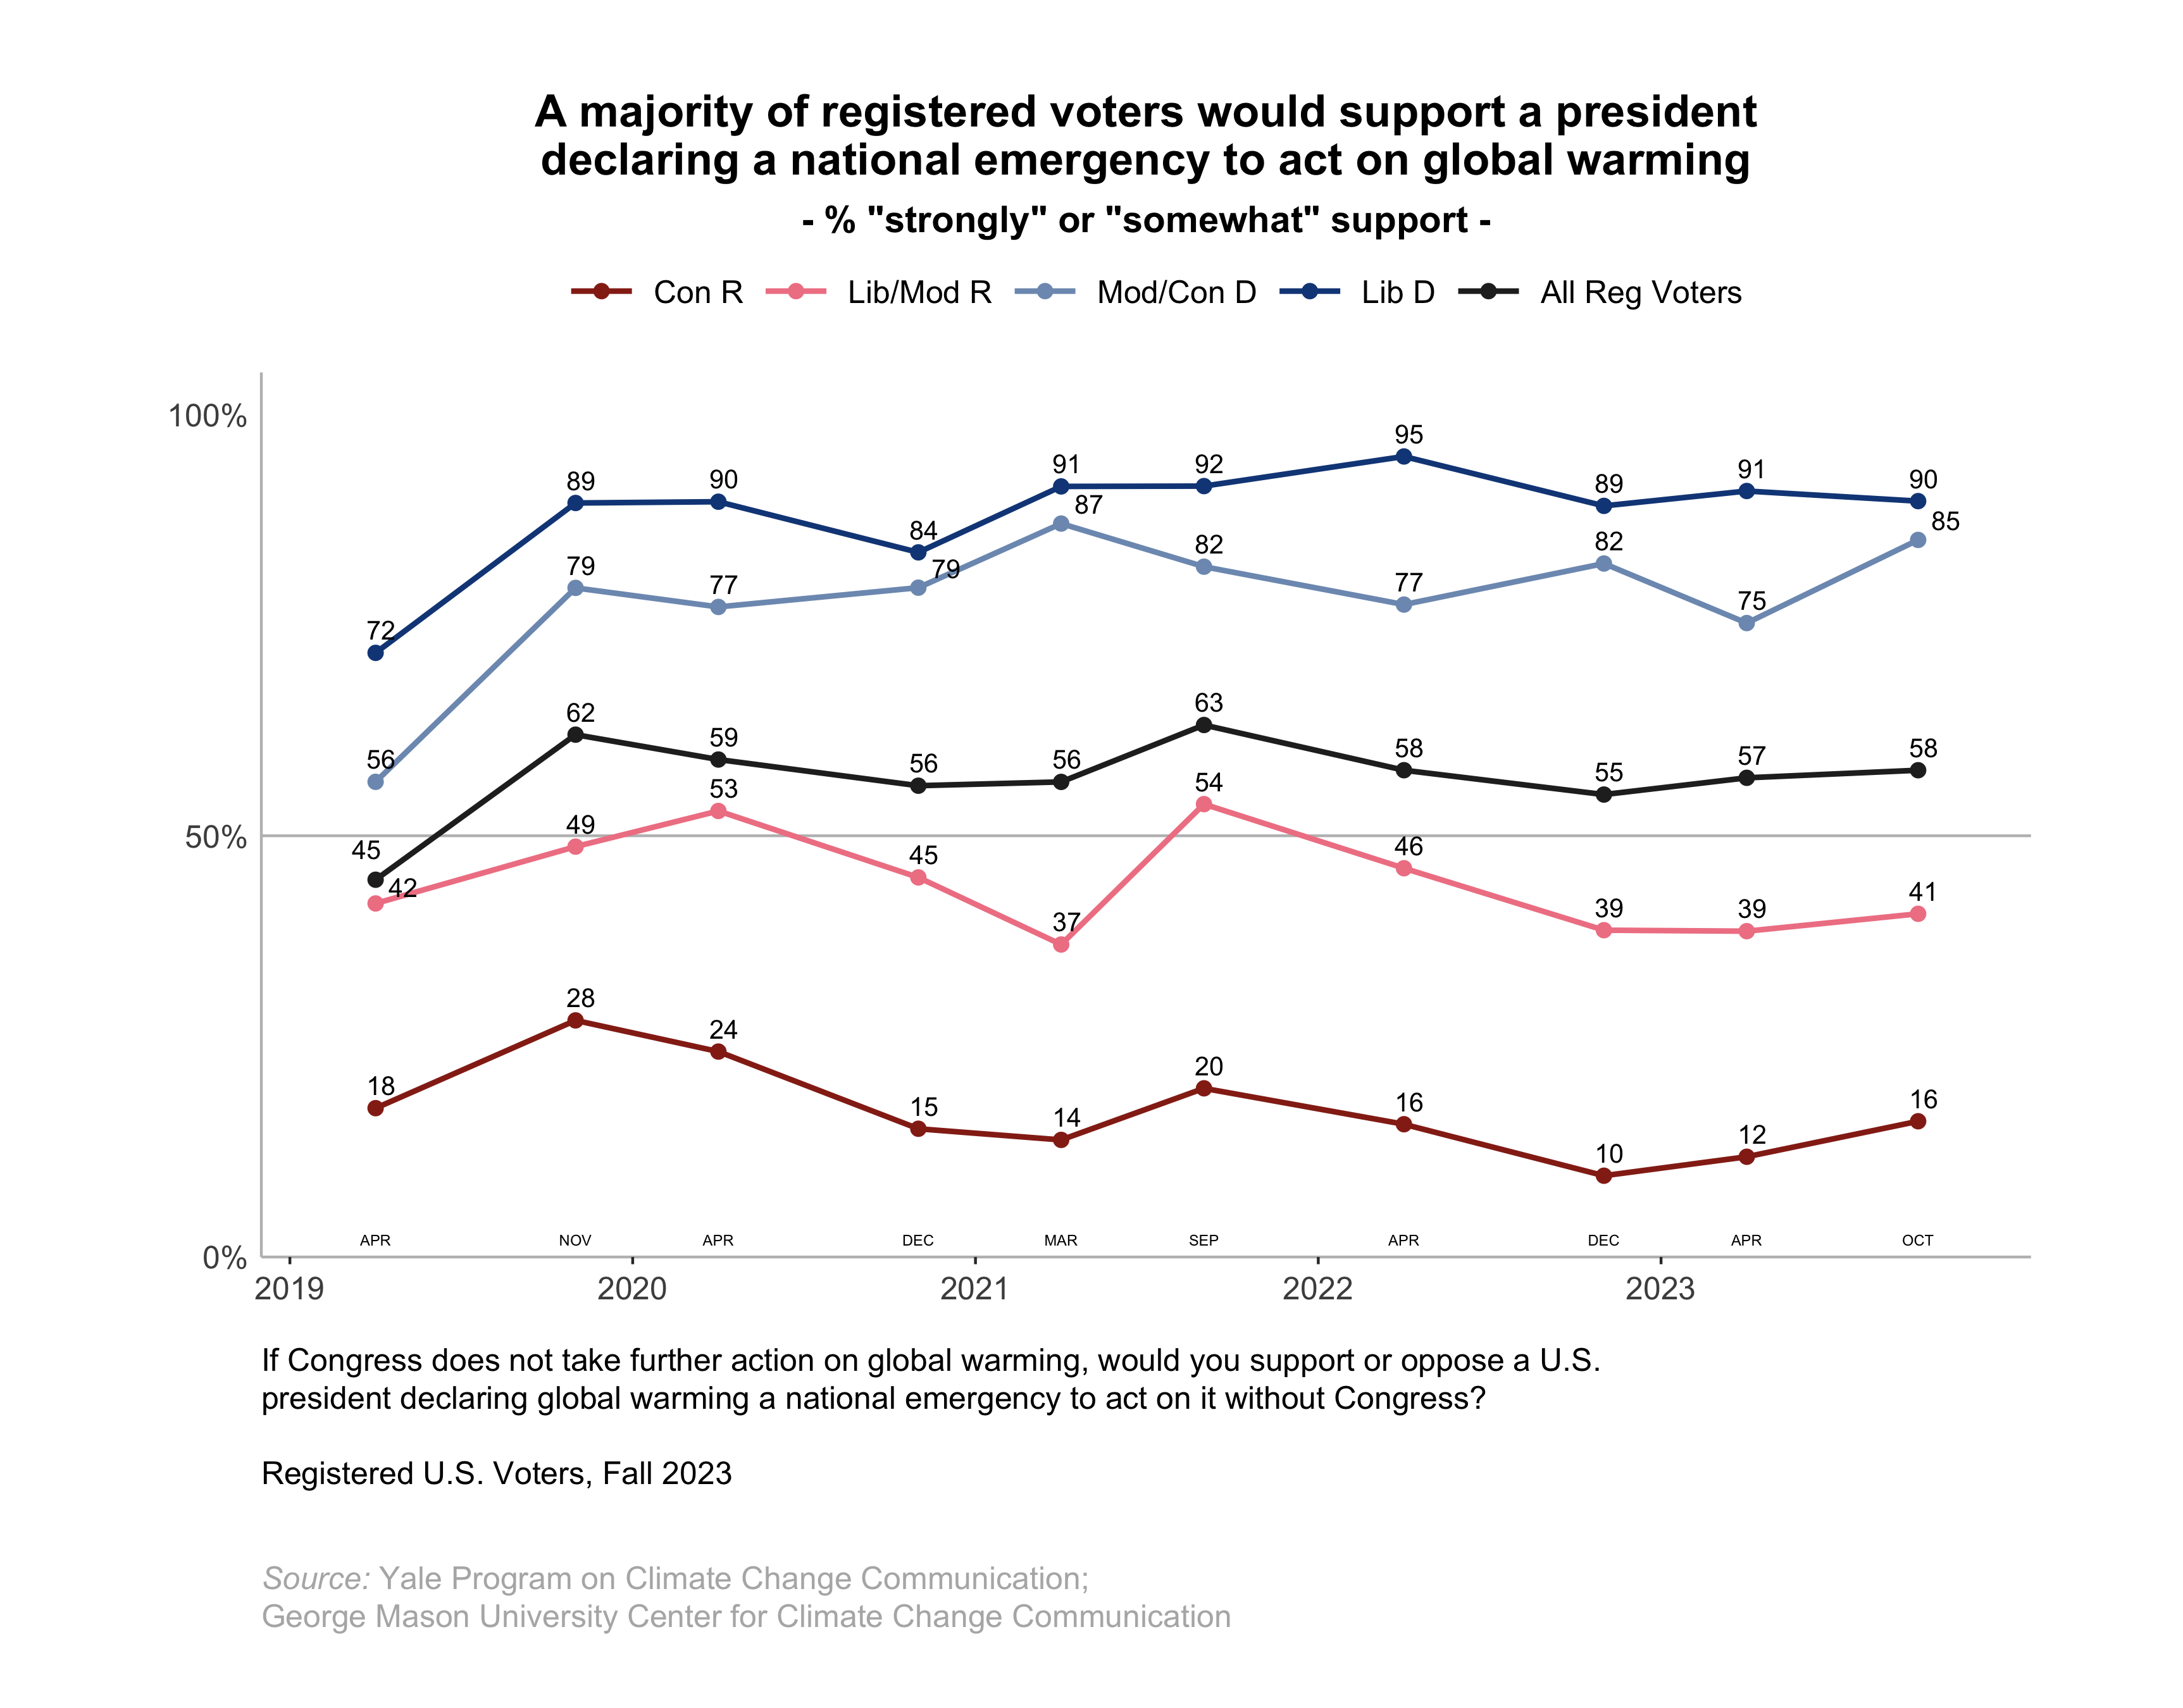
Declaring Climate Change a National Emergency
- 58% of registered voters support a U.S. president declaring global warming a national emergency if Congress does not take further action.
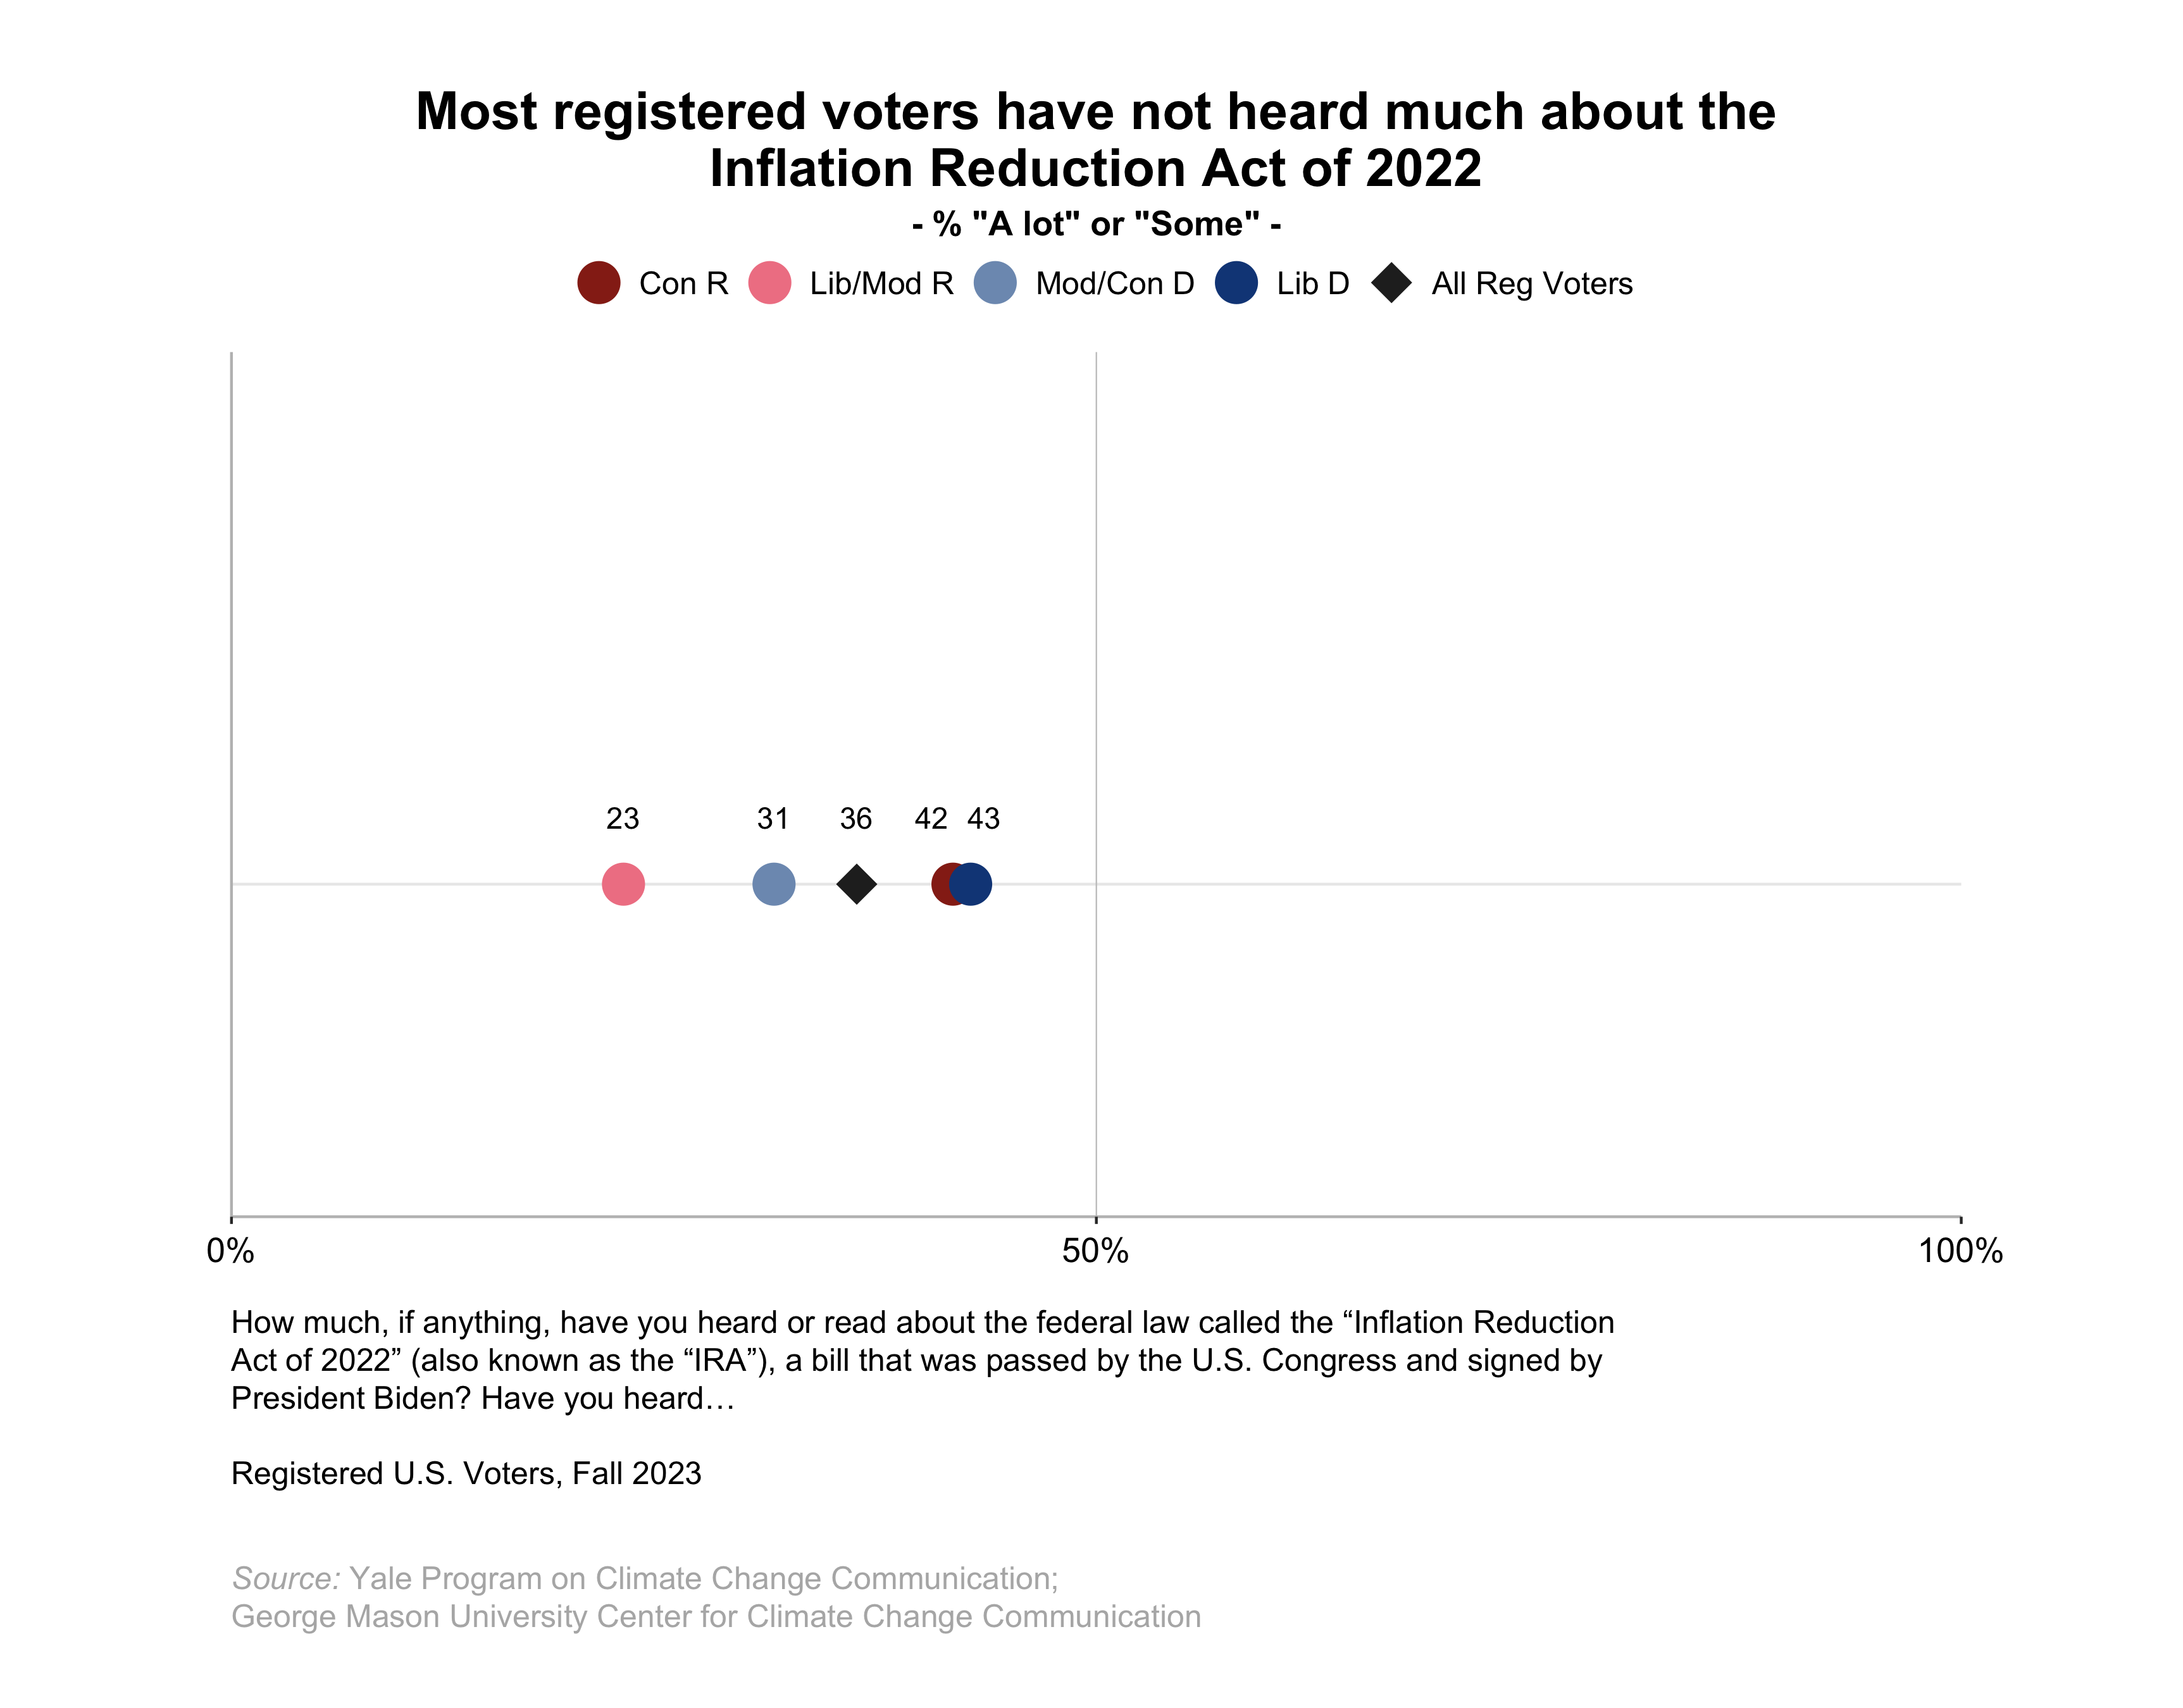
The Inflation Reduction Act of 2022 (IRA)
On August 16, 2022, President Joe Biden signed the Inflation Reduction Act (IRA) into law. The law aims to curb inflation, reduce prescription drug prices and the cost of health insurance, modernize the Internal Revenue Service, and invest in U.S. clean energy production. The law will be paid for by closing tax loopholes.
- 36% of registered voters have heard either “a lot” or “some” about the IRA.
- After reading a short description of the IRA, 71% of registered voters support it.
- Fewer than half of registered voters think the IRA will help future generations of people (46%), the health of Americans (45%), low-income communities and communities of color (40%), the economy and jobs in the U.S. (38%), their family (33%), or them personally (30%).
Energy Production as an Economic Issue
- 45% of registered voters think policies that promote clean energy will improve economic growth and create jobs.
- 57% of registered voters think the clean energy industry will create more good jobs than the fossil fuel industry.
Who Should Act?
- Half or more registered voters say the following should do more to address global warming: Corporations and industry (68%), the Republican Party (62%), citizens themselves (62%), the U.S. Congress (61%), their local government officials (55%), the Democratic Party (55%), the media (55%), their governor (53%), President Biden (52%), and they themselves (50%).
- Only 12% of registered voters think the U.S. government is responding well to global warming.
Participation by the United States in International Climate Action
- 60% of registered voters think the U.S. should reduce its greenhouse gas emissions regardless of what other countries do.
- Majorities of registered voters support providing financial aid and technical support to developing countries to limit their greenhouse gas emissions (i.e., mitigation; 60%) and to help them prepare for the impacts of global warming (i.e., adaptation; 57%).
- 40% of registered voters support the U.S. contributing to an international “loss and damage fund” to provide financial assistance to low-income countries that are most harmed by global warming and least responsible for causing it. An additional 26% of registered voters neither support nor oppose this.
Perceptions of Fossil Fuel Companies
- Only 18% of registered voters trust fossil fuel companies to act in the public’s best interest, while 35% trust renewable energy companies to do so.
- 70% of registered voters say fossil fuel companies have too much influence on government decisions.
- 47% of registered voters think fossil fuel companies should be allowed to participate in international climate negotiations.
- Only 19% of registered voters think fossil fuel companies should receive financial support from the government.
Political Actions to Limit Global Warming
- 51% of registered voters say they would sign a petition about global warming if a person they like and respect asked them to, although only 14% say they have signed such a petition in the past year.
- 25% of registered voters say they would donate money to an organization working on global warming if asked by a person they like and respect (compared with 11% who say they have done so in the past year), 25% say they would contact government officials about global warming (compared with 7% who say they have done so in the past year), and 24% say they would volunteer their time to an organization working on global warming (compared with 4% who say they have done so in the past year).
- 20% say they would support an organization engaging in non-violent civil disobedience against corporate or government activities that make global warming worse, 12% say they would personally engage in non-violent civil disobedience (compared with 1% who say they have done so in the past year), and 4% say they would be willing to get arrested as part of such an action.
- 2% say they are currently participating in a campaign to convince elected officials to take action to reduce global warming, while 6% say they would “definitely” join such a campaign and 18% would “probably” join one.
Consumer Actions to Limit Global Warming
- 26% of registered voters say they have rewarded companies that are taking steps to reduce global warming by buying their products in the past 12 months, and 20% say they have punished companies that are opposing steps to reduce global warming by not buying their products.
- 35% of registered voters say that, over the next 12 months, they would like to punish companies that are opposing steps to reduce global warming by not buying their products more frequently than they are now, and 34% say they intend to buy the products of companies that are taking steps to reduce global warming more frequently than they do now.
Collective Efficacy
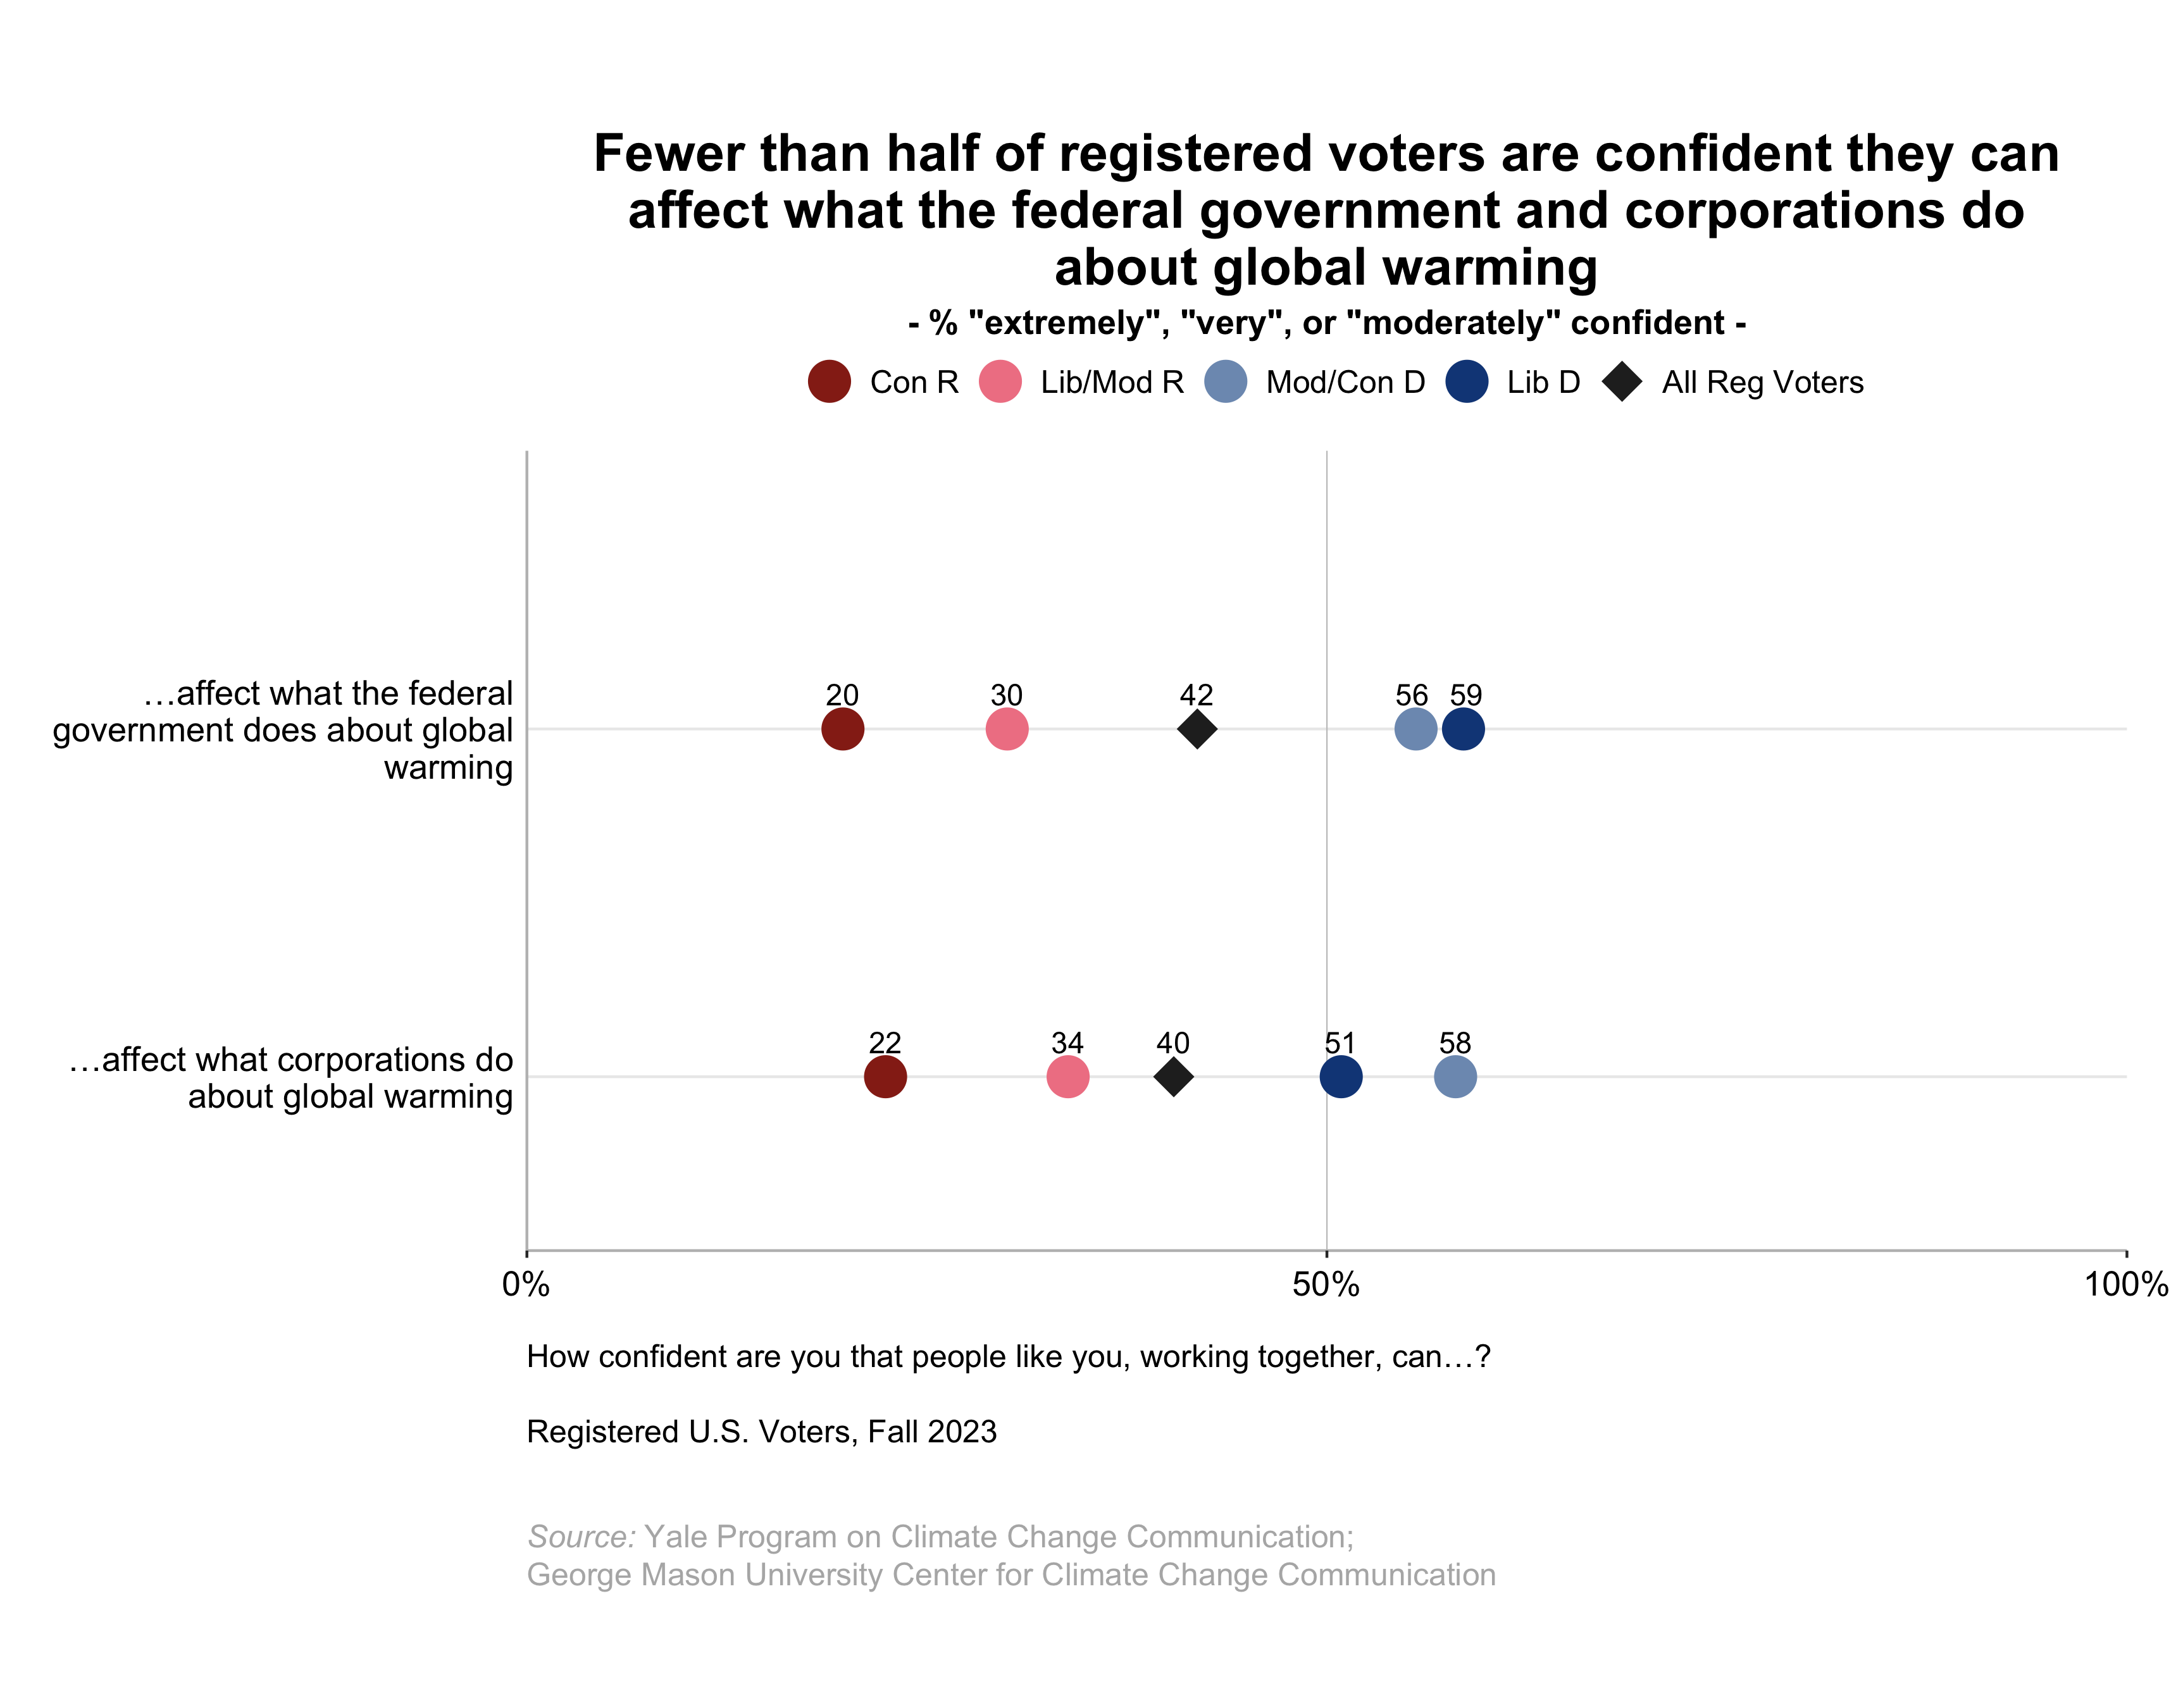
- 42% of registered voters think people like them, working together, can affect what the federal government does about global warming, and 40% think they can affect what corporations do about global warming.
Educating Students About Global Warming
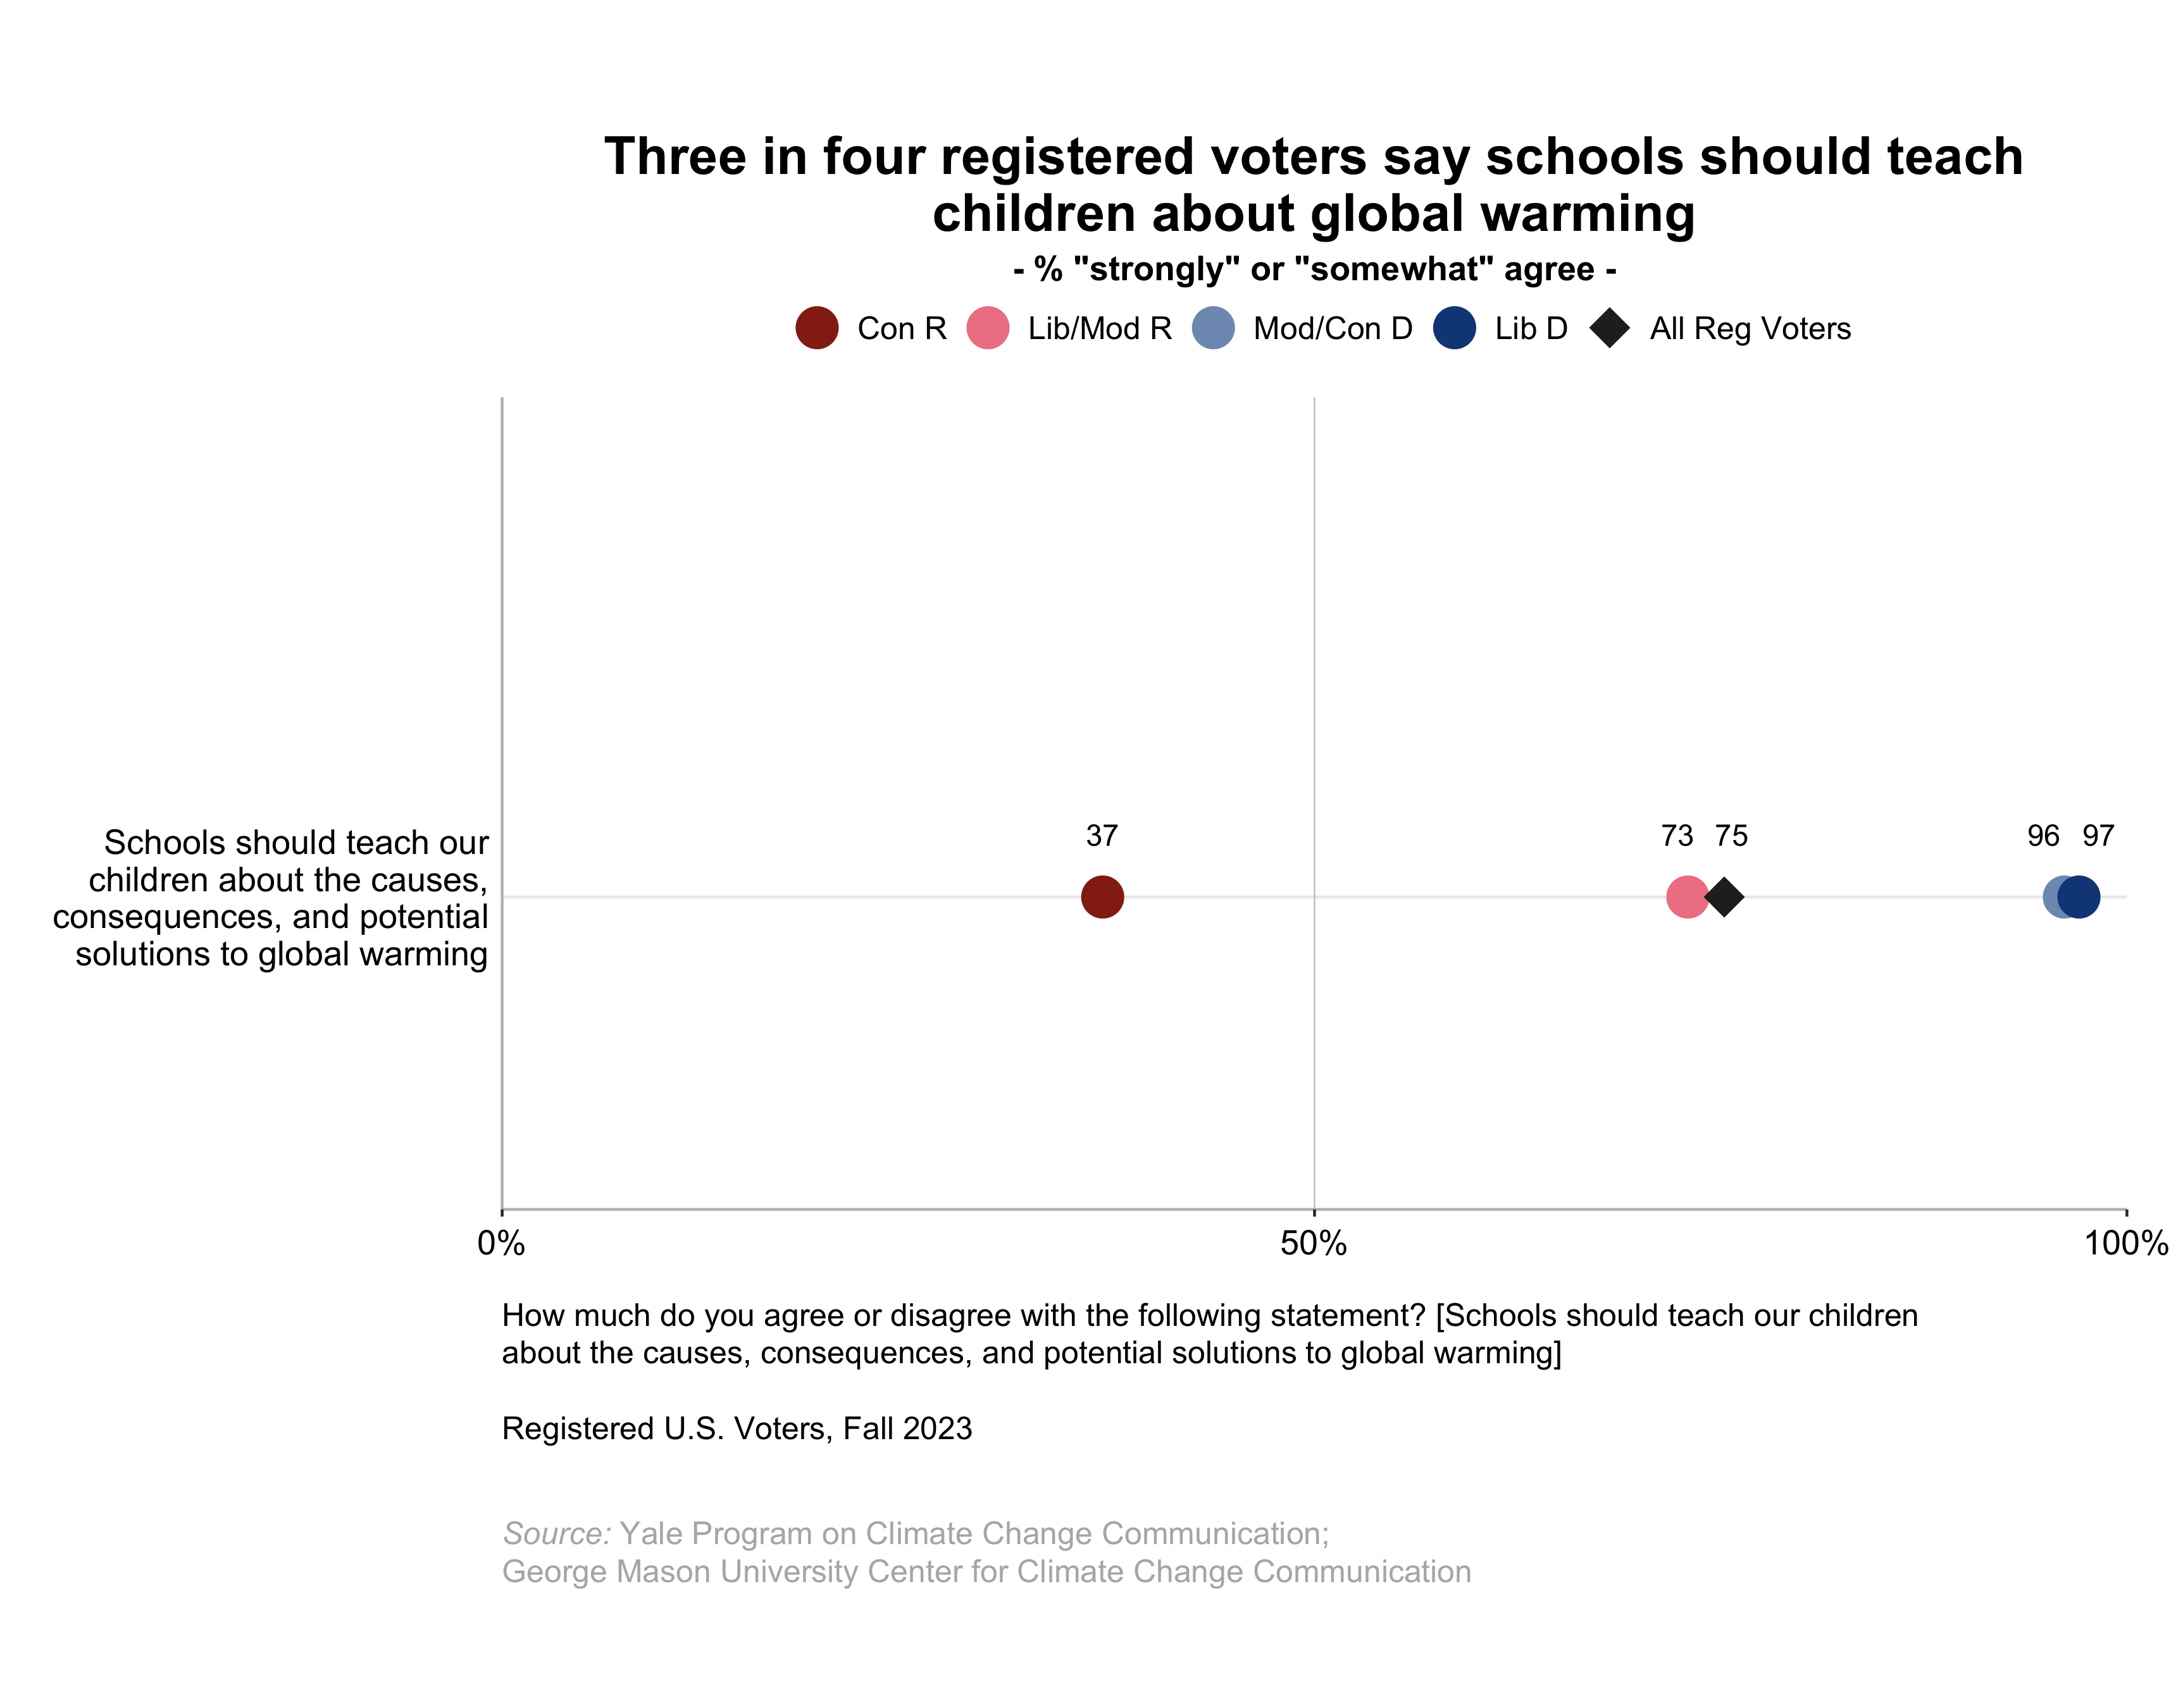
- 75% of registered voters think schools should teach children about the causes and consequences of global warming, and potential solutions.
1. Global Warming as a Voting Issue
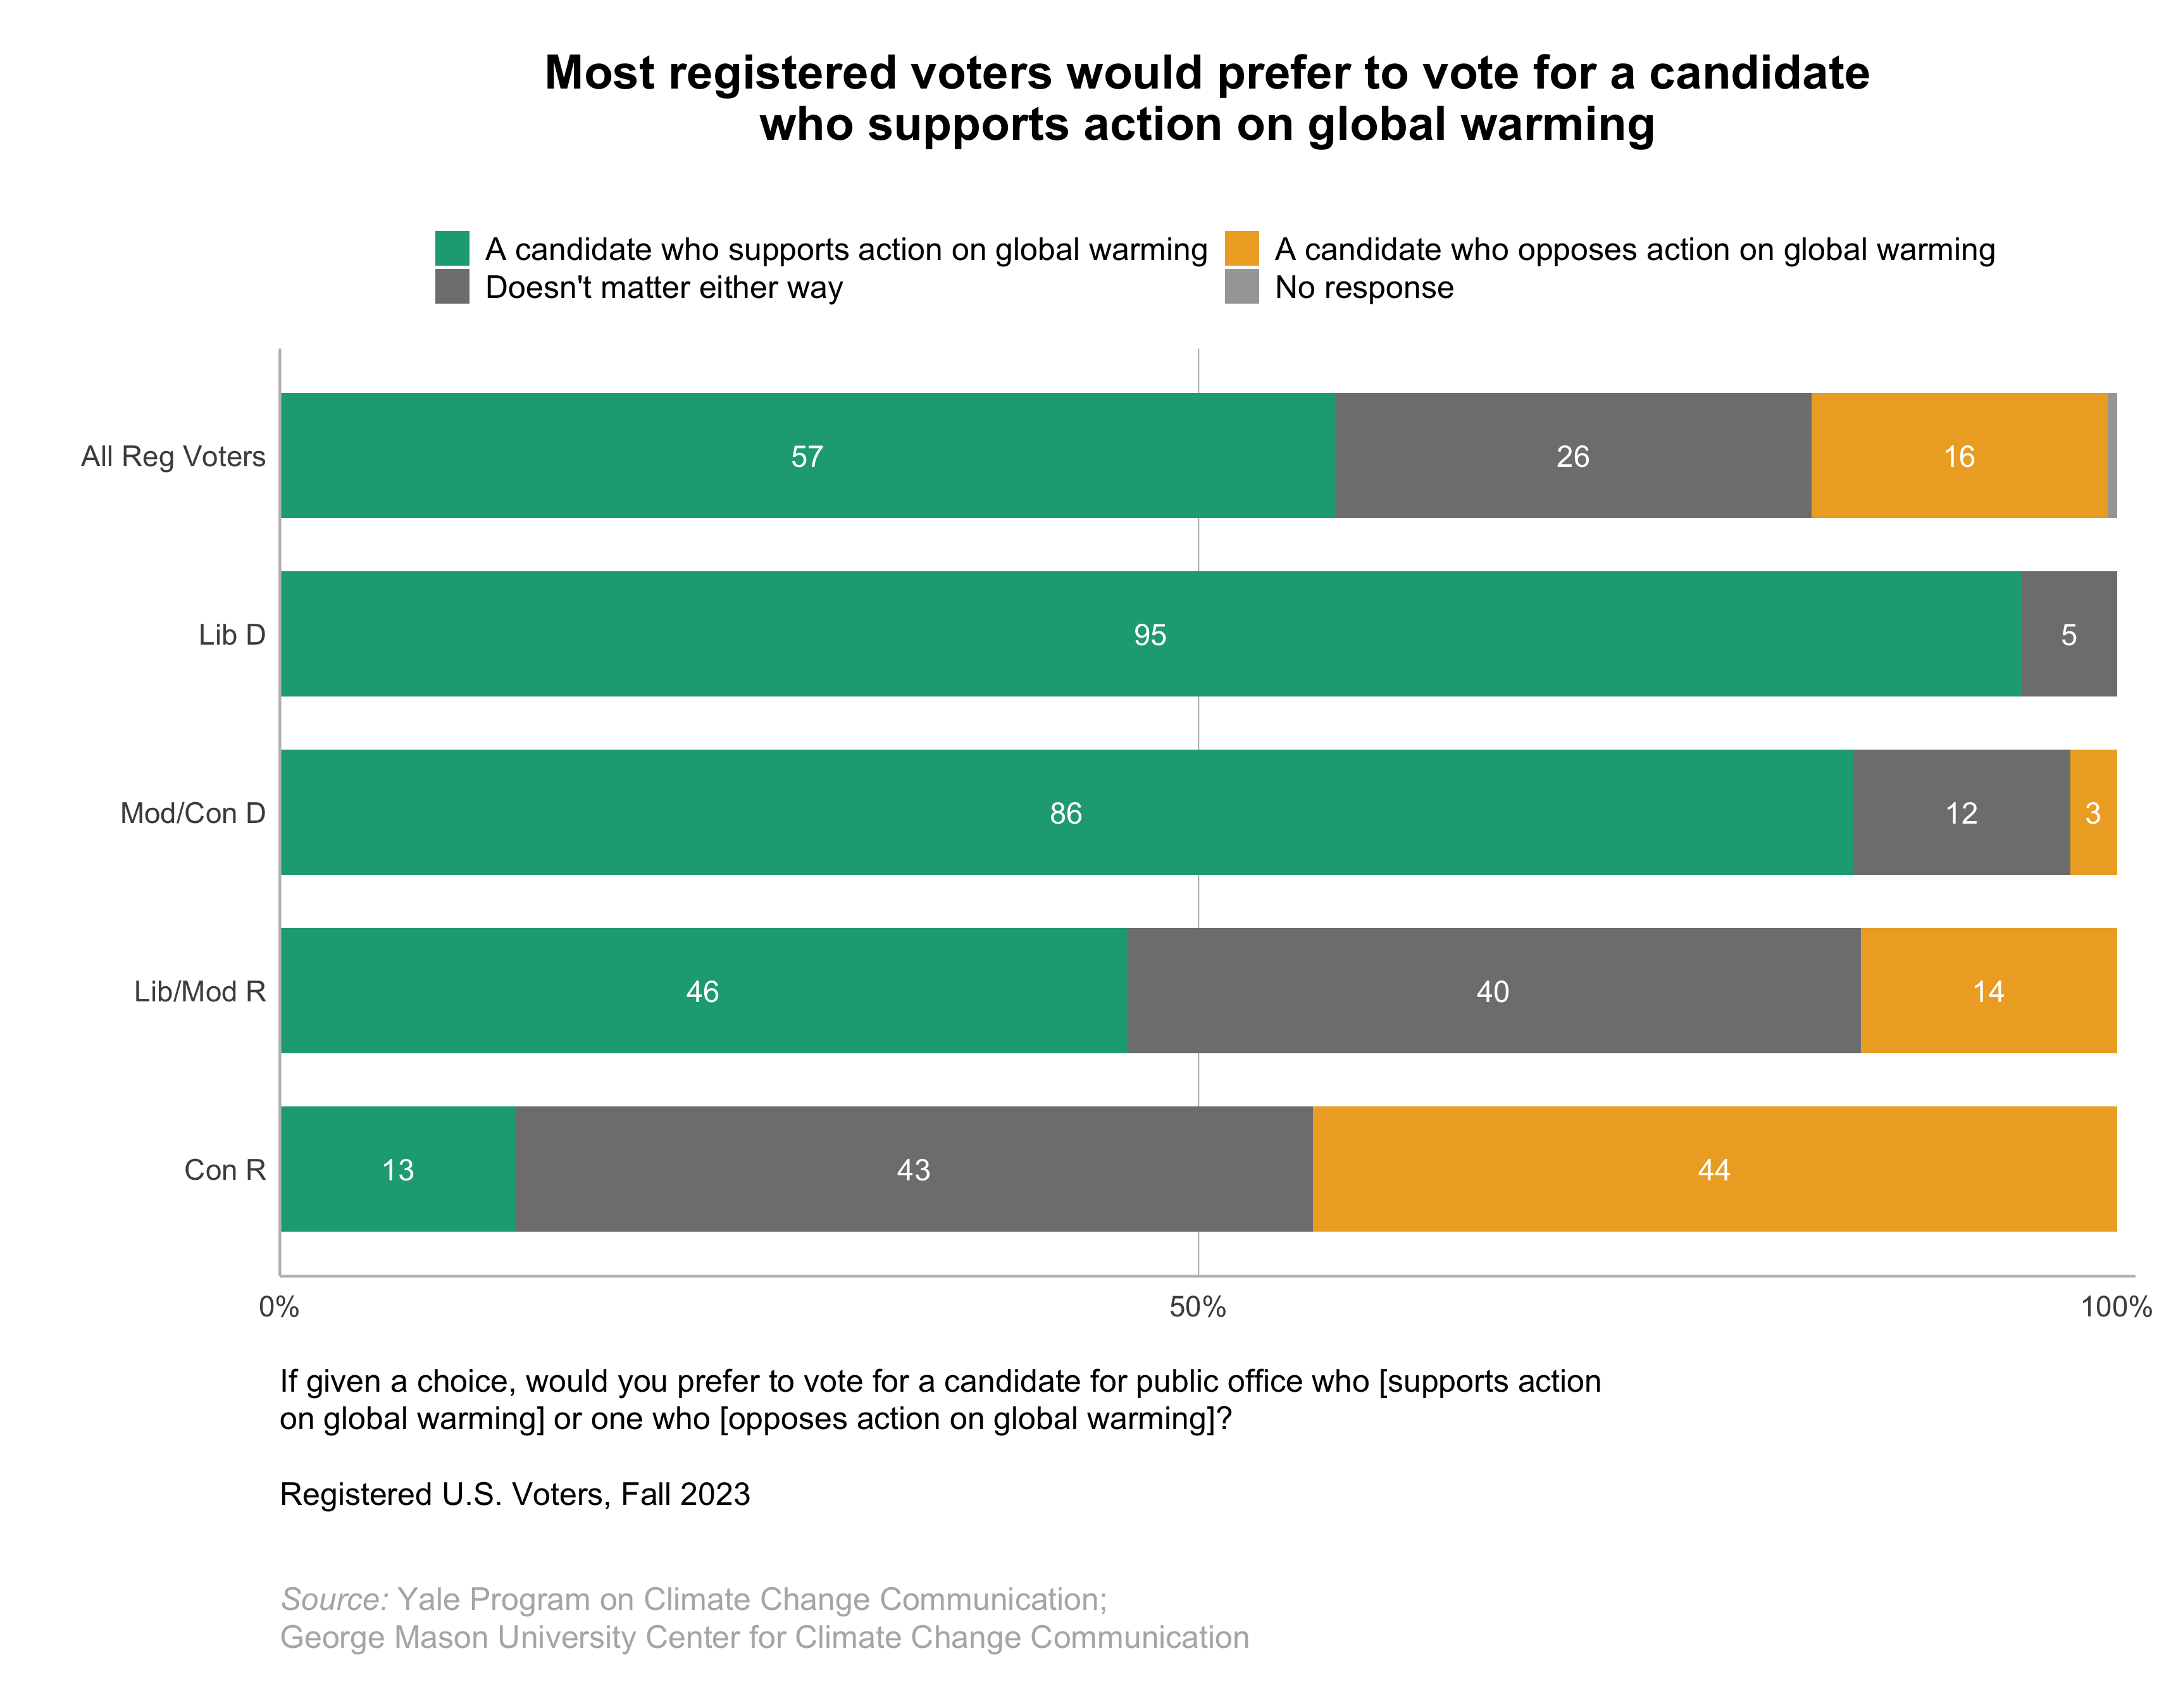
1.1. Most registered voters would prefer to vote for a candidate who supports action on global warming.
If given a choice, a majority of registered voters (57%) would prefer to vote for a candidate for public office who supports action on global warming, while only 16% would prefer to vote for a candidate who opposes action, and 26% say it doesn’t matter either way.
Nearly all liberal Democrats (95%), a large majority of moderate/conservative Democrats (86%; an increase of 10 percentage points since we last asked this question in April 2022), and about half of Independents (52%; refer to data tables, p. 43) would prefer to vote for a candidate who supports action on global warming, as would 46% of liberal/moderate Republicans. In contrast, only 13% of conservative Republicans would prefer to vote for a candidate who supports action on global warming (a decline of 10 percentage points since April 2022), while 44% of conservative Republicans would prefer to vote for a candidate who opposes action.
2. Global Warming and Clean Energy as Government Priorities
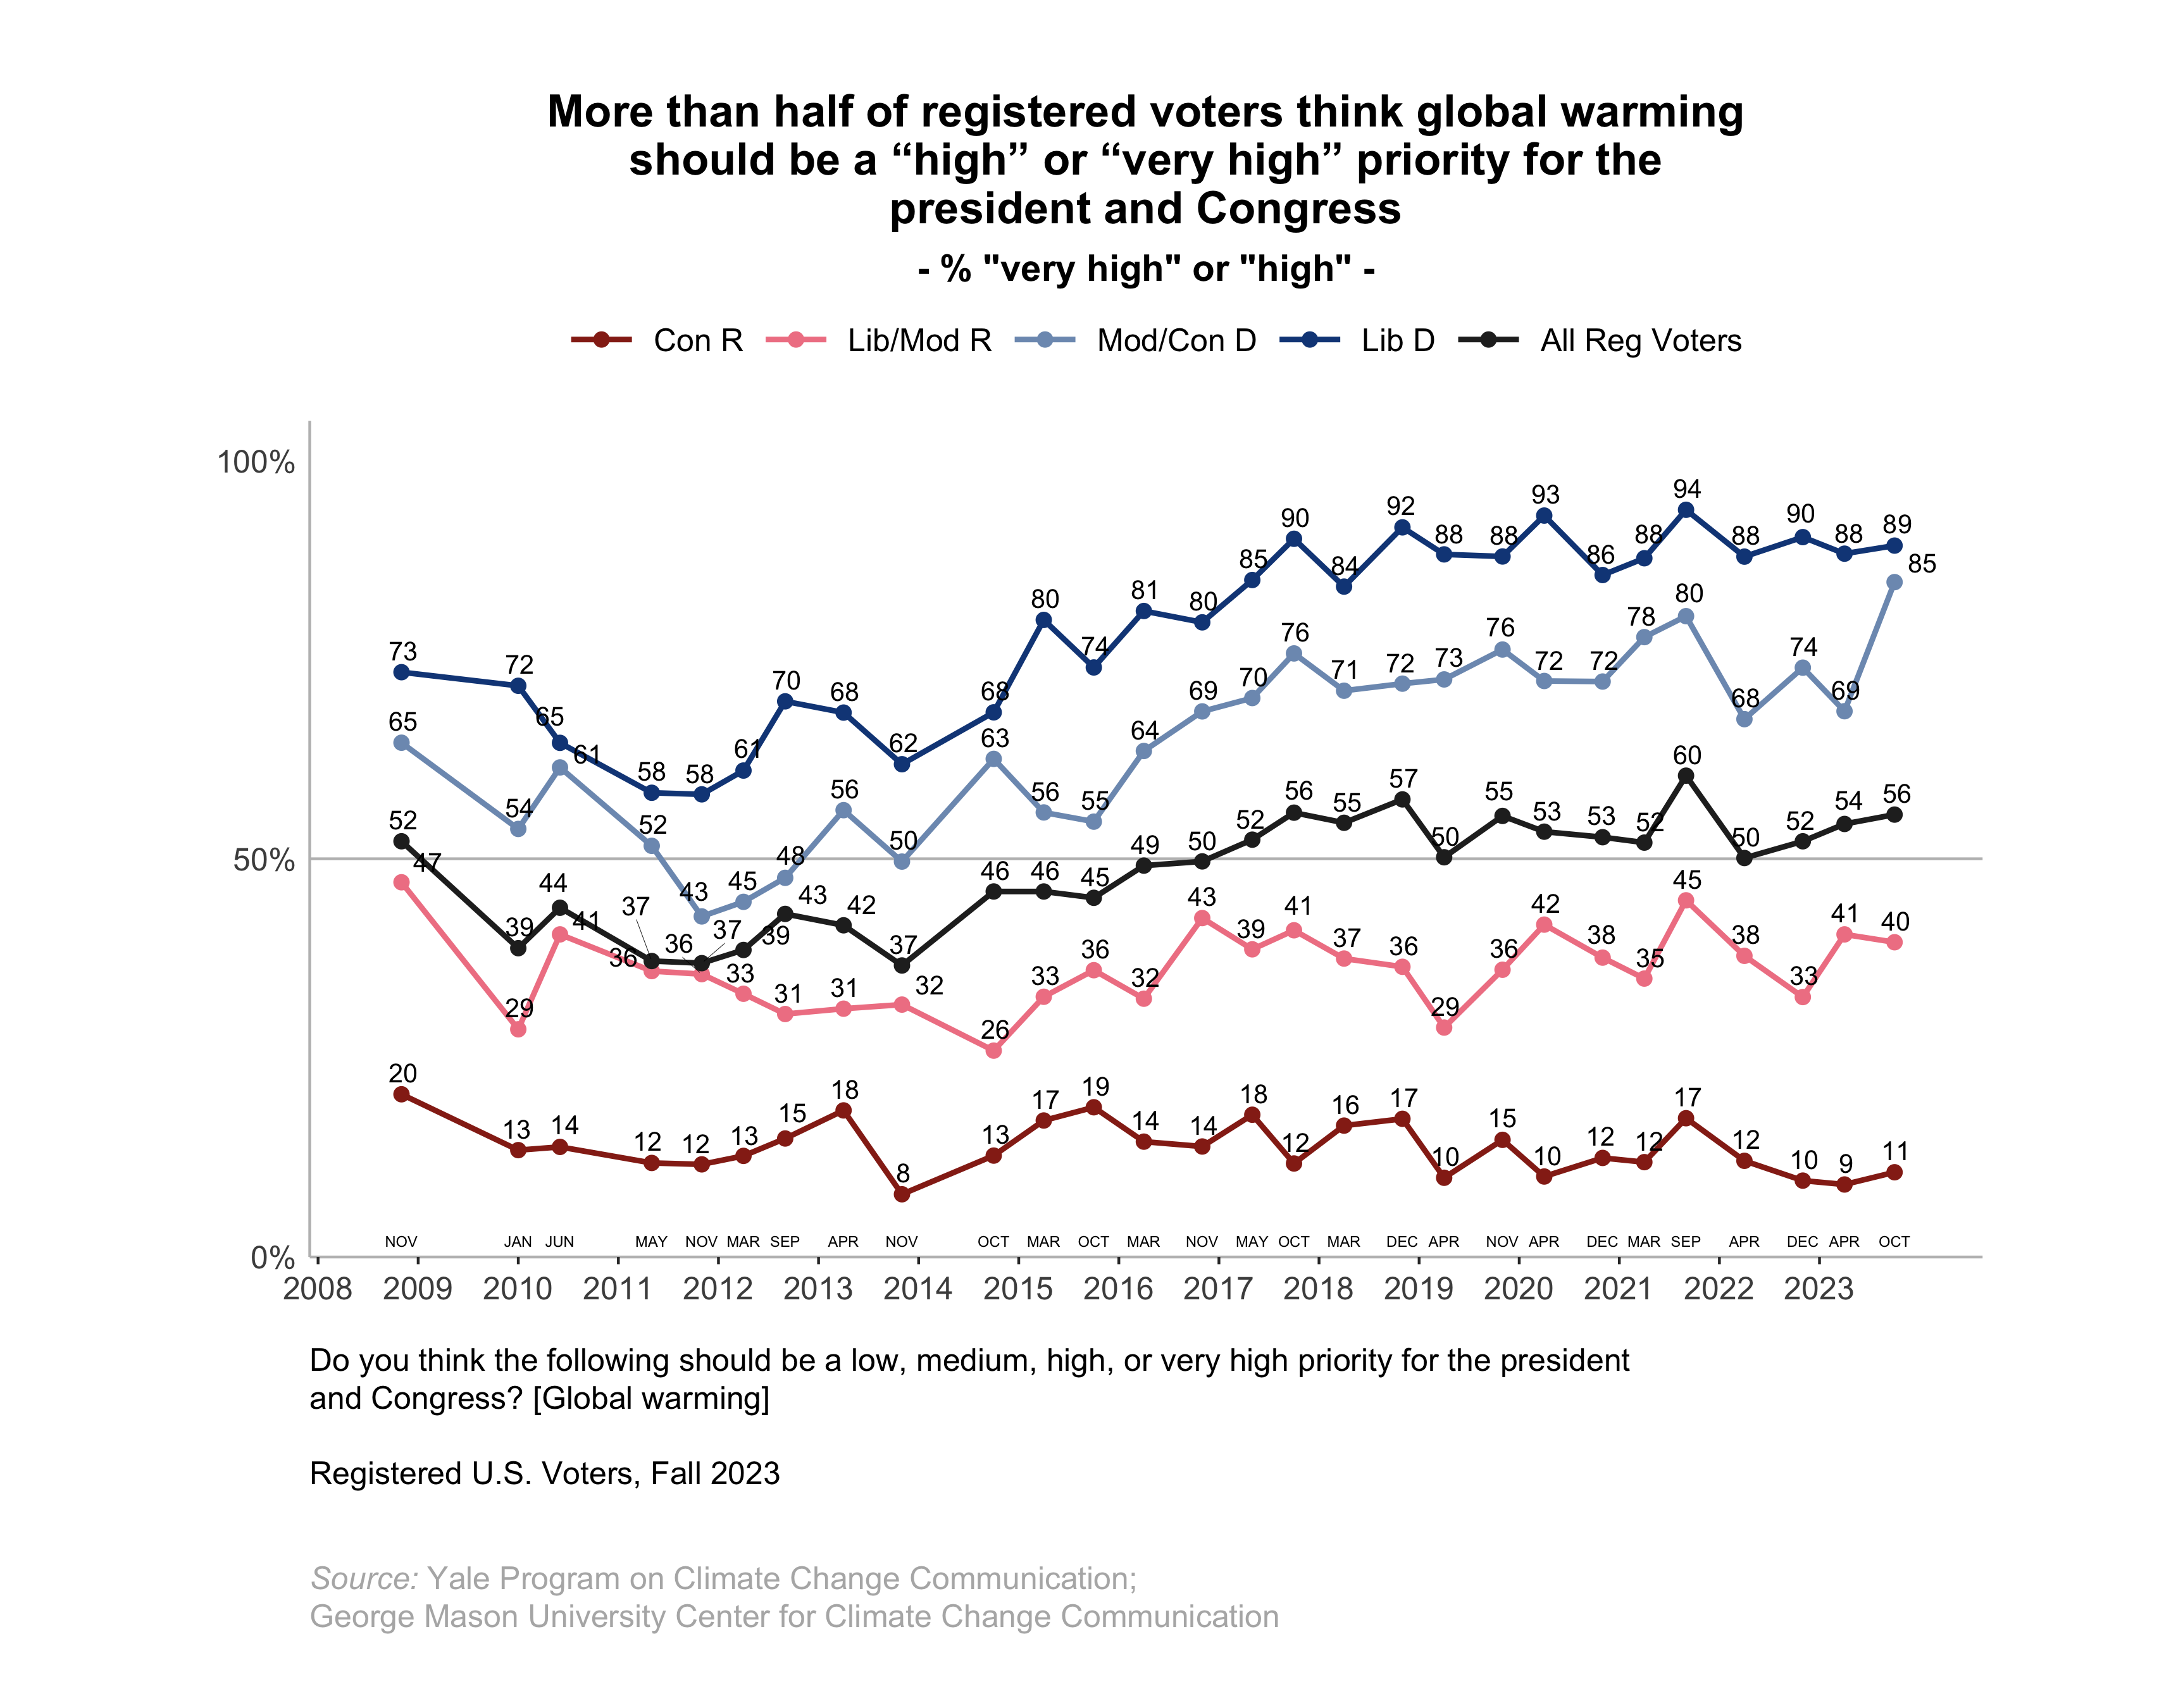
2.1. More than half of registered voters think global warming should be a “high” or “very high” priority for the president and Congress.
More than half of registered voters (56%) think global warming should be a high or very high priority for the president and Congress (refer to data tables, p. 43). This includes large majorities of liberal Democrats (89%) and moderate/conservative Democrats (85%; the highest level for this group on this question since these surveys began in 2008), and four in ten liberal/moderate Republicans (40%). Few conservative Republicans (11%) think so.
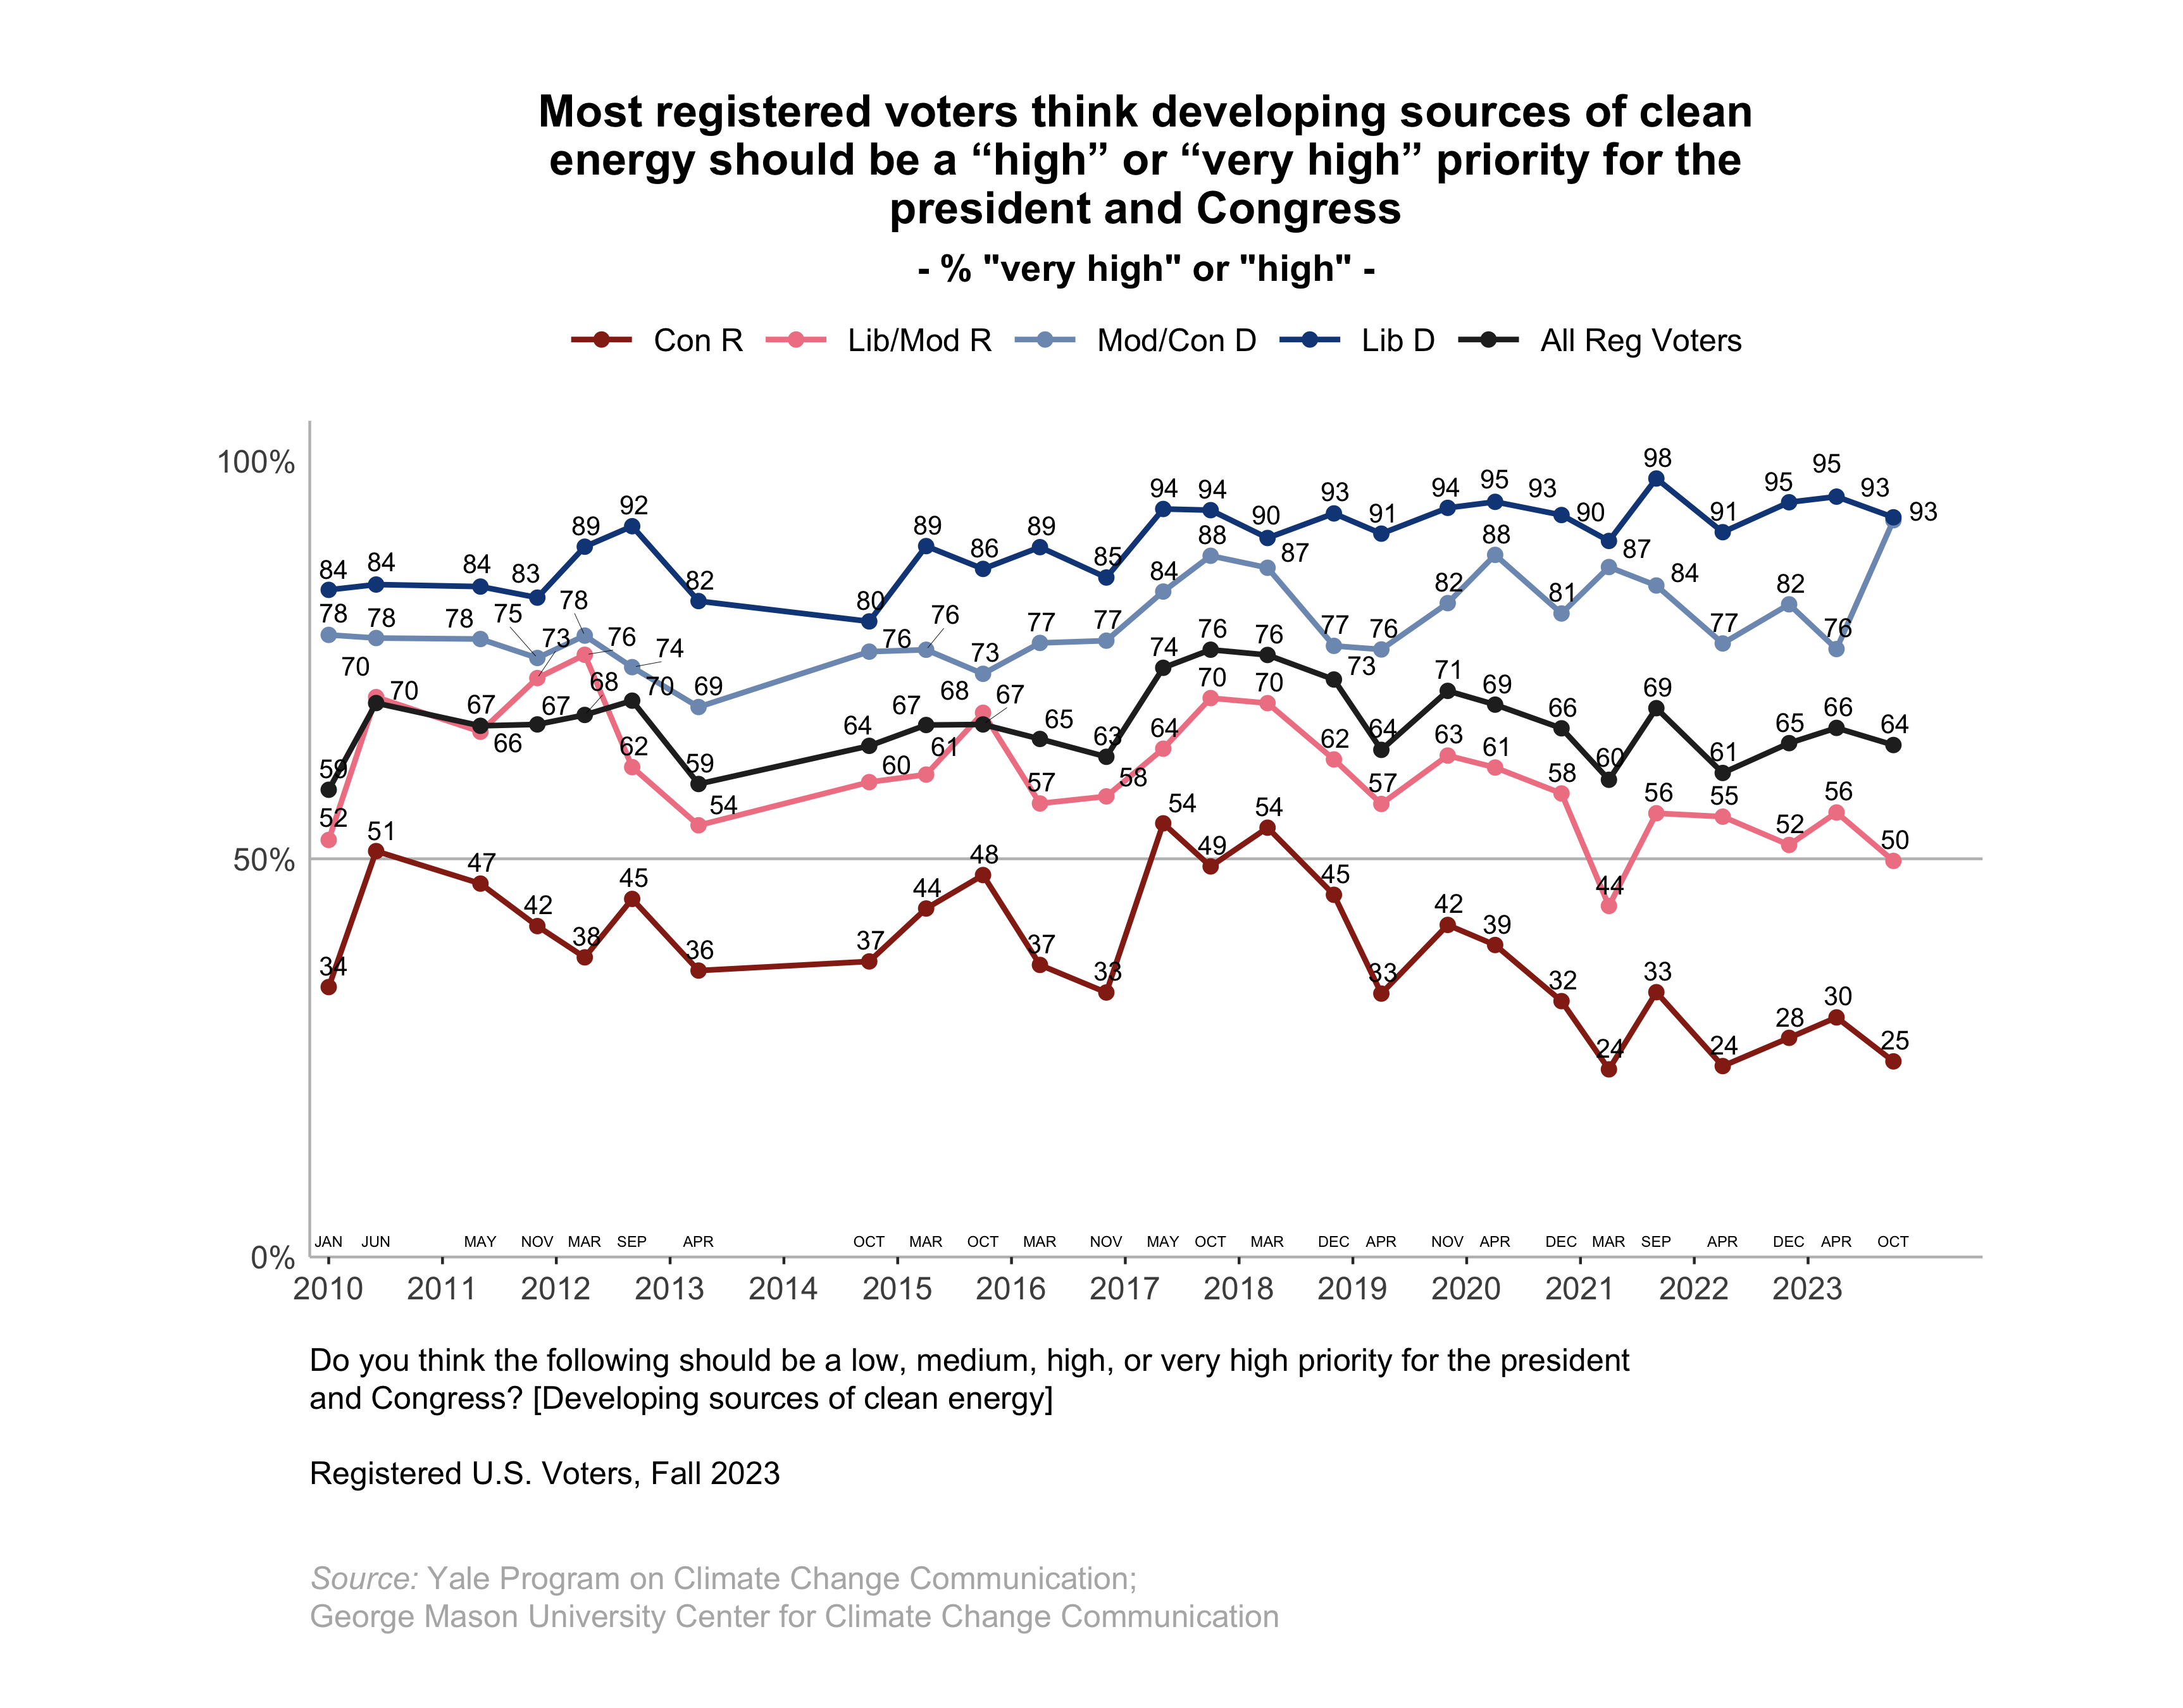
2.2. Most registered voters think developing sources of clean energy should be a “high” or “very high” priority for the president and Congress.
More than six in ten registered voters (64%) think developing sources of clean energy should be a high or very high priority for the president and Congress (refer to data tables, p. 43). This includes large majorities of liberal Democrats (93%) and moderate/conservative Democrats (93%; the highest level for this group on this question since these surveys began in 2008), half of liberal/moderate Republicans (50%), but only 25% of conservative Republicans.
3. Support for Policies to Reduce the Pollution that Causes Global Warming
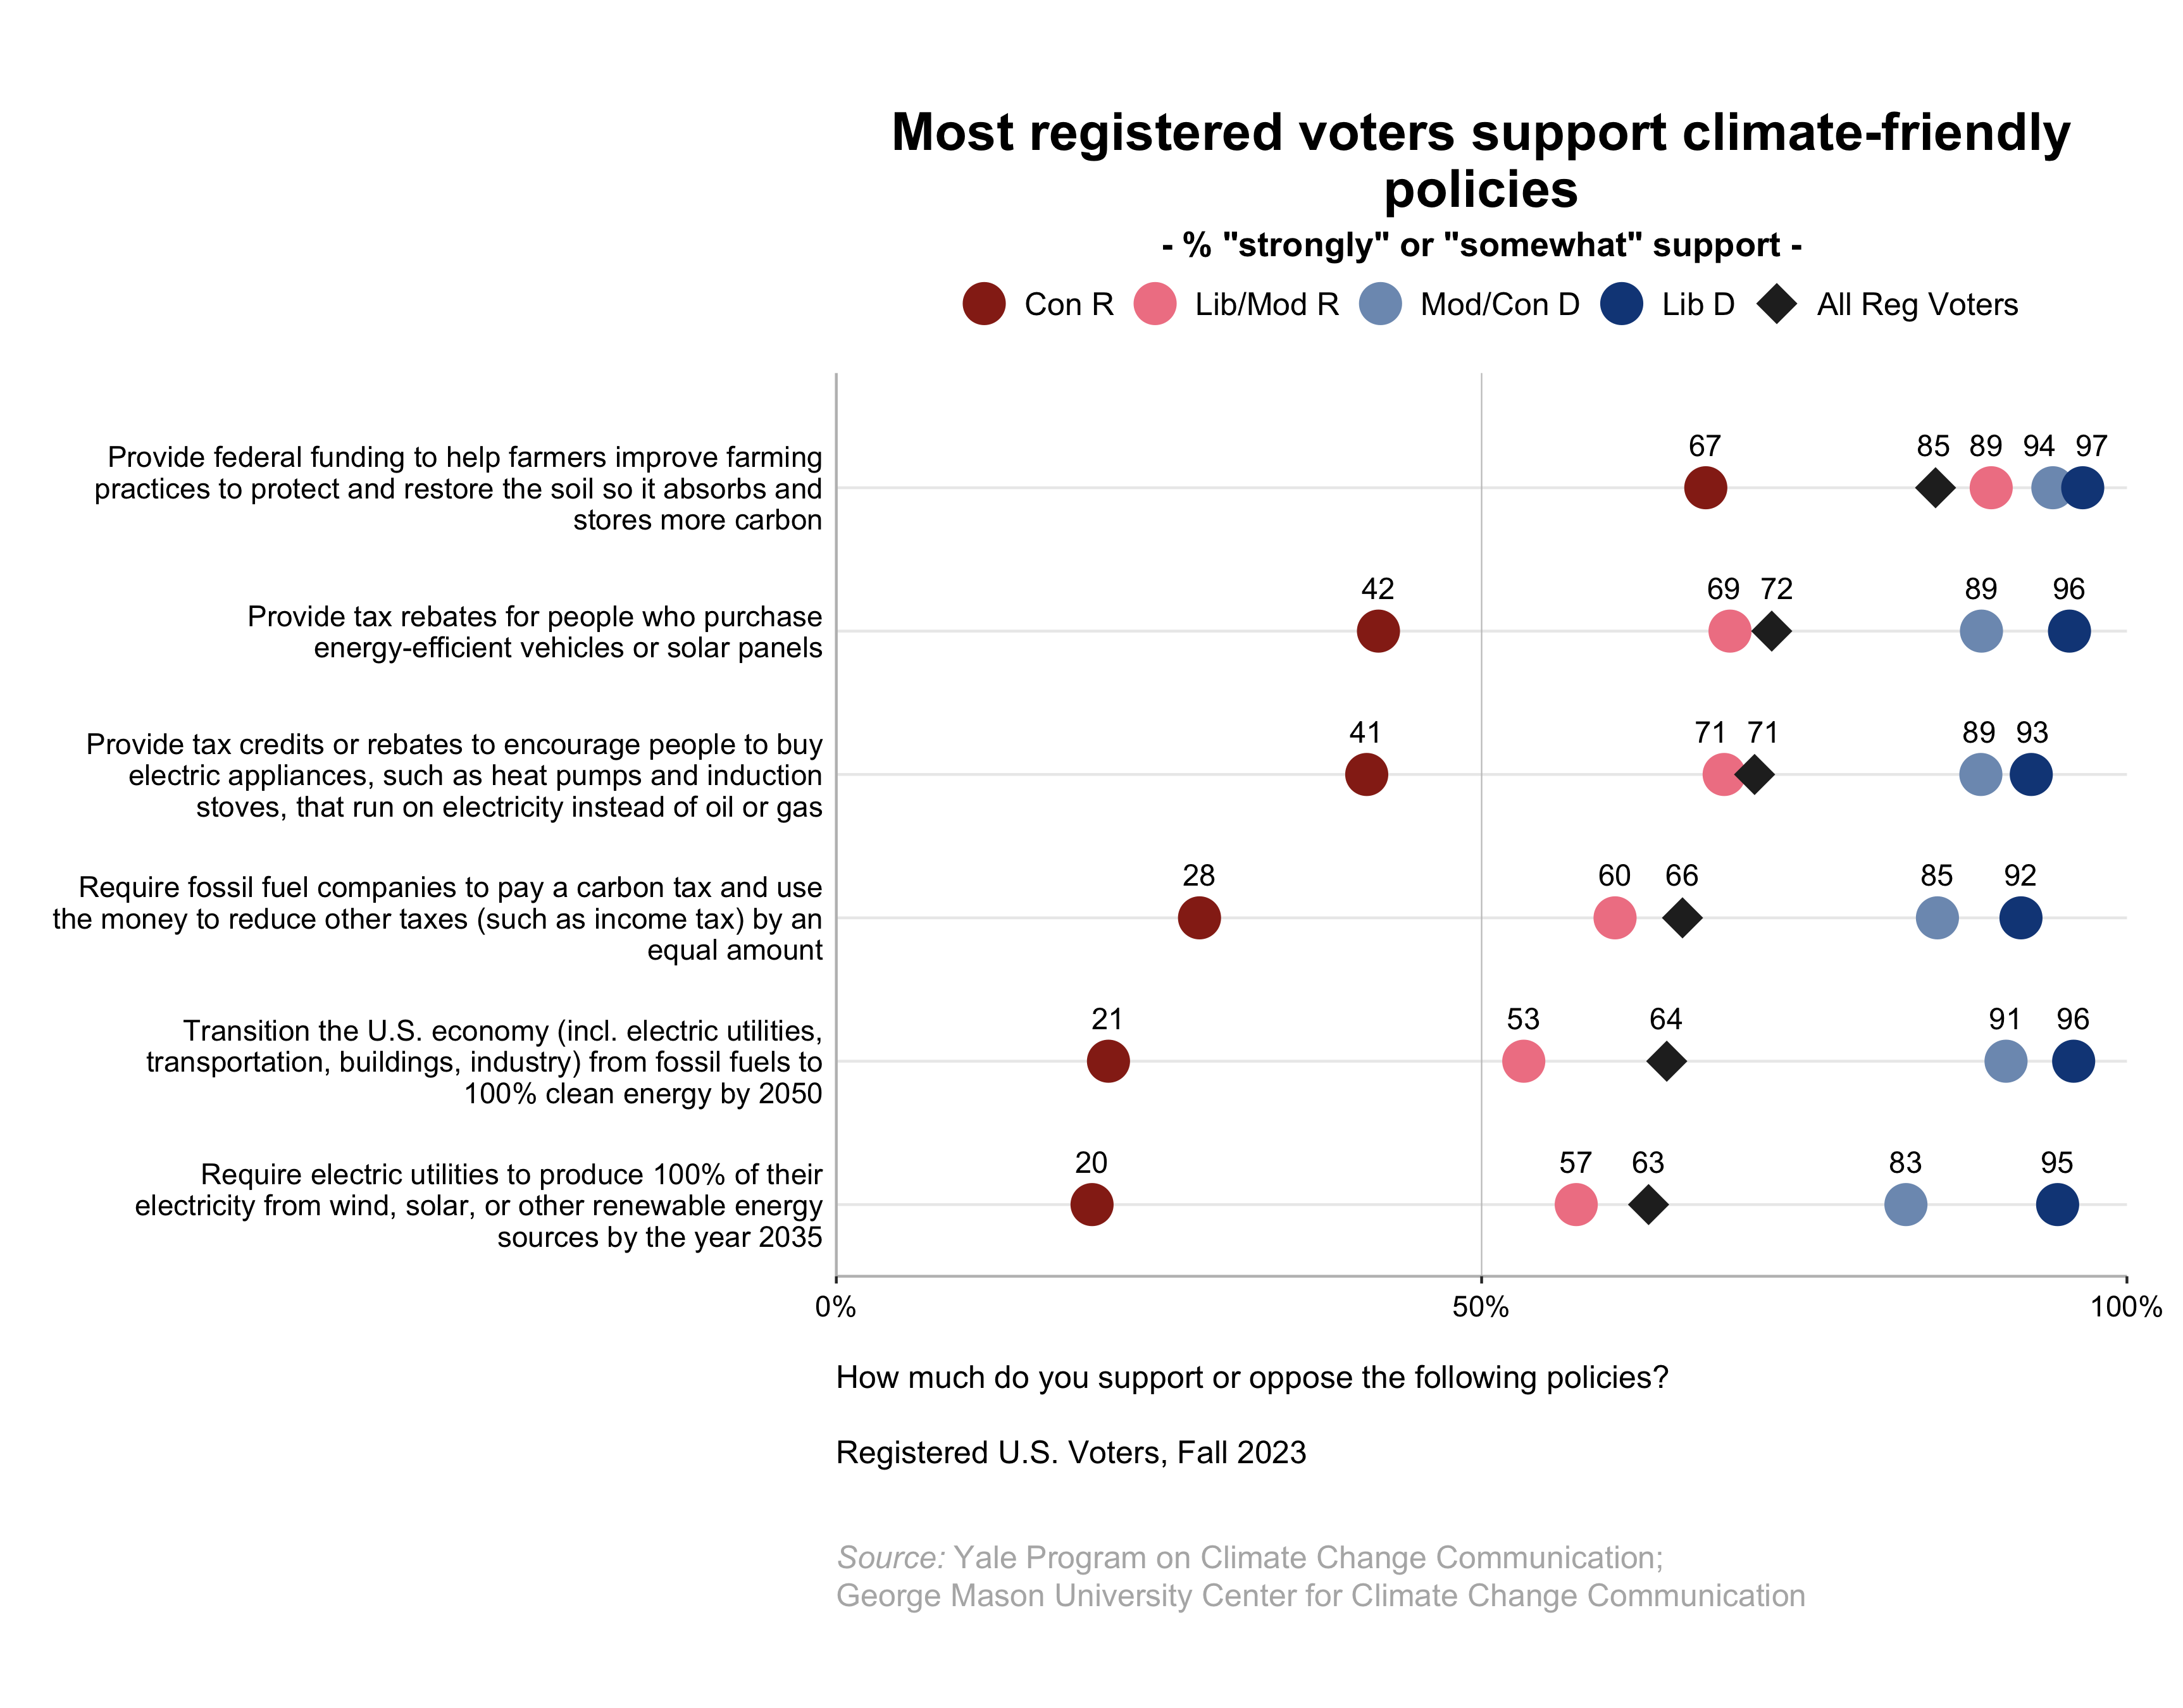
3.1. Most registered voters support climate-friendly policies.
Registered voters across the political spectrum support many energy policies designed to reduce carbon pollution and fossil fuel dependence and promote clean energy, including:
- Providing federal funding to help farmers improve practices to protect and restore the soil so it absorbs and stores more carbon: 85% of registered voters, including 97% of liberal Democrats, 94% of moderate/conservative Democrats, 89% of liberal/moderate Republicans, and 67% of conservative Republicans.
- Providing tax rebates to people who purchase energy-efficient vehicles or solar panels: 72% of registered voters, including 96% of liberal Democrats, 89% of moderate/conservative Democrats, 69% of liberal/moderate Republicans, and 42% of conservative Republicans.
- Providing tax credits or rebates to encourage people to buy electric appliances, such as heat pumps and induction stoves, that run on electricity instead of oil or gas: 71% of registered voters, including 93% of liberal Democrats, 89% of moderate/conservative Democrats, 71% of liberal/moderate Republicans, and 41% of conservative Republicans.
- Requiring fossil fuel companies to pay a carbon tax and using the money to reduce other taxes (such as income tax) by an equal amount [i.e., a revenue-neutral carbon tax]: 66% of registered voters, including 92% of liberal Democrats, 85% of moderate/conservative Democrats, 60% of liberal/moderate Republicans, and 28% of conservative Republicans.
- Transitioning the U.S. economy (including electric utilities, transportation, buildings, and industry) from fossil fuels to 100% clean energy by 2050: 64% of registered voters, including 96% of liberal Democrats, 91% of moderate/conservative Democrats, 53% of liberal/moderate Republicans, and 21% of conservative Republicans.
- Requiring electric utilities to produce 100% of their electricity from renewable energy sources by 2035: 63% of registered voters, including 95% of liberal Democrats, 83% of moderate/conservative Democrats, 57% of liberal/moderate Republicans, and 20% of conservative Republicans.
3.2. A large majority of registered voters support renewable energy generation on public land.
A large majority of registered voters (78%) support generating renewable energy (solar and wind) on public land in the United States. This includes nearly all liberal Democrats (94%) and moderate/conservative Democrats (91%) as well as a large majority of liberal/moderate Republicans (79%) and about half of conservative Republicans (55%).
Fewer registered voters support fossil-fuel production in the United States, including:
- Expanding offshore drilling for oil and natural gas off the U.S. coast: 52% of registered voters; 81% of conservative Republicans, 76% of liberal/moderate Republicans, 39% of moderate/conservative Democrats, and 26% of liberal Democrats.
- Drilling for and mining fossil fuels (coal, oil, and natural gas) on public land in the U.S.: 49% of registered voters; 80% of conservative Republicans, 73% of liberal/moderate Republicans, 33% of moderate/conservative Democrats, and 20% of liberal Democrats.
3.3. A majority of registered voters support building clean energy infrastructure in their local area.
Majorities of registered voters support climate-friendly energy production and distribution infrastructure in their local area, including solar farms (61%), wind farms (55%), electric vehicle charging stations (52%), and high-voltage power lines to distribute clean energy (52%). This generally includes majorities of liberal Democrats and moderate/conservative Democrats, and many liberal/moderate Republicans, but fewer conservative Republicans:
- Solar farms: liberal Democrats, 81%; moderate/conservative Democrats, 74%; liberal/moderate Republicans, 54%; conservative Republicans, 37%.
- Wind farms: liberal Democrats, 76%; moderate/conservative Democrats, 69%; liberal/moderate Republicans, 50%; conservative Republicans, 30%.
- Electric vehicle charging stations: liberal Democrats, 83%; moderate/conservative Democrats, 65%; liberal/moderate Republicans, 36%; conservative Republicans, 25%.
- High-voltage power lines to distribute clean energy: liberal Democrats, 66%; moderate/conservative Democrats, 60%; liberal/moderate Republicans, 41%; conservative Republicans, 42%.
Fewer registered voters support building nuclear power plants in their local area (31%), including 43% of conservative Republicans, 29% of liberal Democrats, 28% of moderate/conservative Democrats, and 20% of liberal/moderate Republicans.
3.4. A majority of registered voters would support a president declaring a national emergency to act on global warming.
More than half of registered voters (58%) would either “strongly” (26%) or “somewhat” (32%) support a U.S. president declaring global warming a national emergency to act on it if Congress does not take further action (refer to data tables, p. 48). This would be supported by large majorities of liberal Democrats (90%, with 56% saying they “strongly support” it) and moderate/conservative Democrats (85%; 36% strongly support). By contrast, 41% of liberal/moderate Republicans and 16% of conservative Republicans would support it, while 59% of liberal/moderate Republicans and 84% of conservative Republicans would oppose it (including 66% who would “strongly oppose” it).
4. The Inflation Reduction Act of 2022 (IRA)
4.1. Most registered voters have not heard much about the Inflation Reduction Act of 2022.
On August 16, 2022, President Joe Biden signed the Inflation Reduction Act (IRA) into law. The law aims to curb inflation by reducing the federal deficit, lowering prescription drug prices and the cost of health insurance, modernizing the Internal Revenue Service, and investing in U.S. clean energy production. The law authorizes $391 billion for developing clean energy and addressing global warming, including tax incentives and rebates to help consumers and businesses buy energy-efficient appliances, solar panels, electric vehicles, etc. The IRA also includes support for clean energy jobs and investments in communities that are most harmed by air and water pollution. It is the largest investment the U.S. government has ever made to reduce global warming, and it is projected to help the U.S. reduce its carbon pollution 40% by 2030. The law will be paid for by closing tax loopholes.
A majority of registered voters (58%) have heard at least “a little” about the Inflation Reduction Act of 2022 (IRA; refer to data tables, p. 49), but only 36% have heard either “a lot” (12%) or “some” (24%) about it. Liberal Democrats (43%) and conservative Republicans (42%) are the most likely to have heard “a lot” or “some” about the IRA, while fewer moderate/conservative Democrats (31%) or liberal/moderate Republicans (23%) have. About four in ten registered voters (41%) have heard “nothing at all” about the IRA.
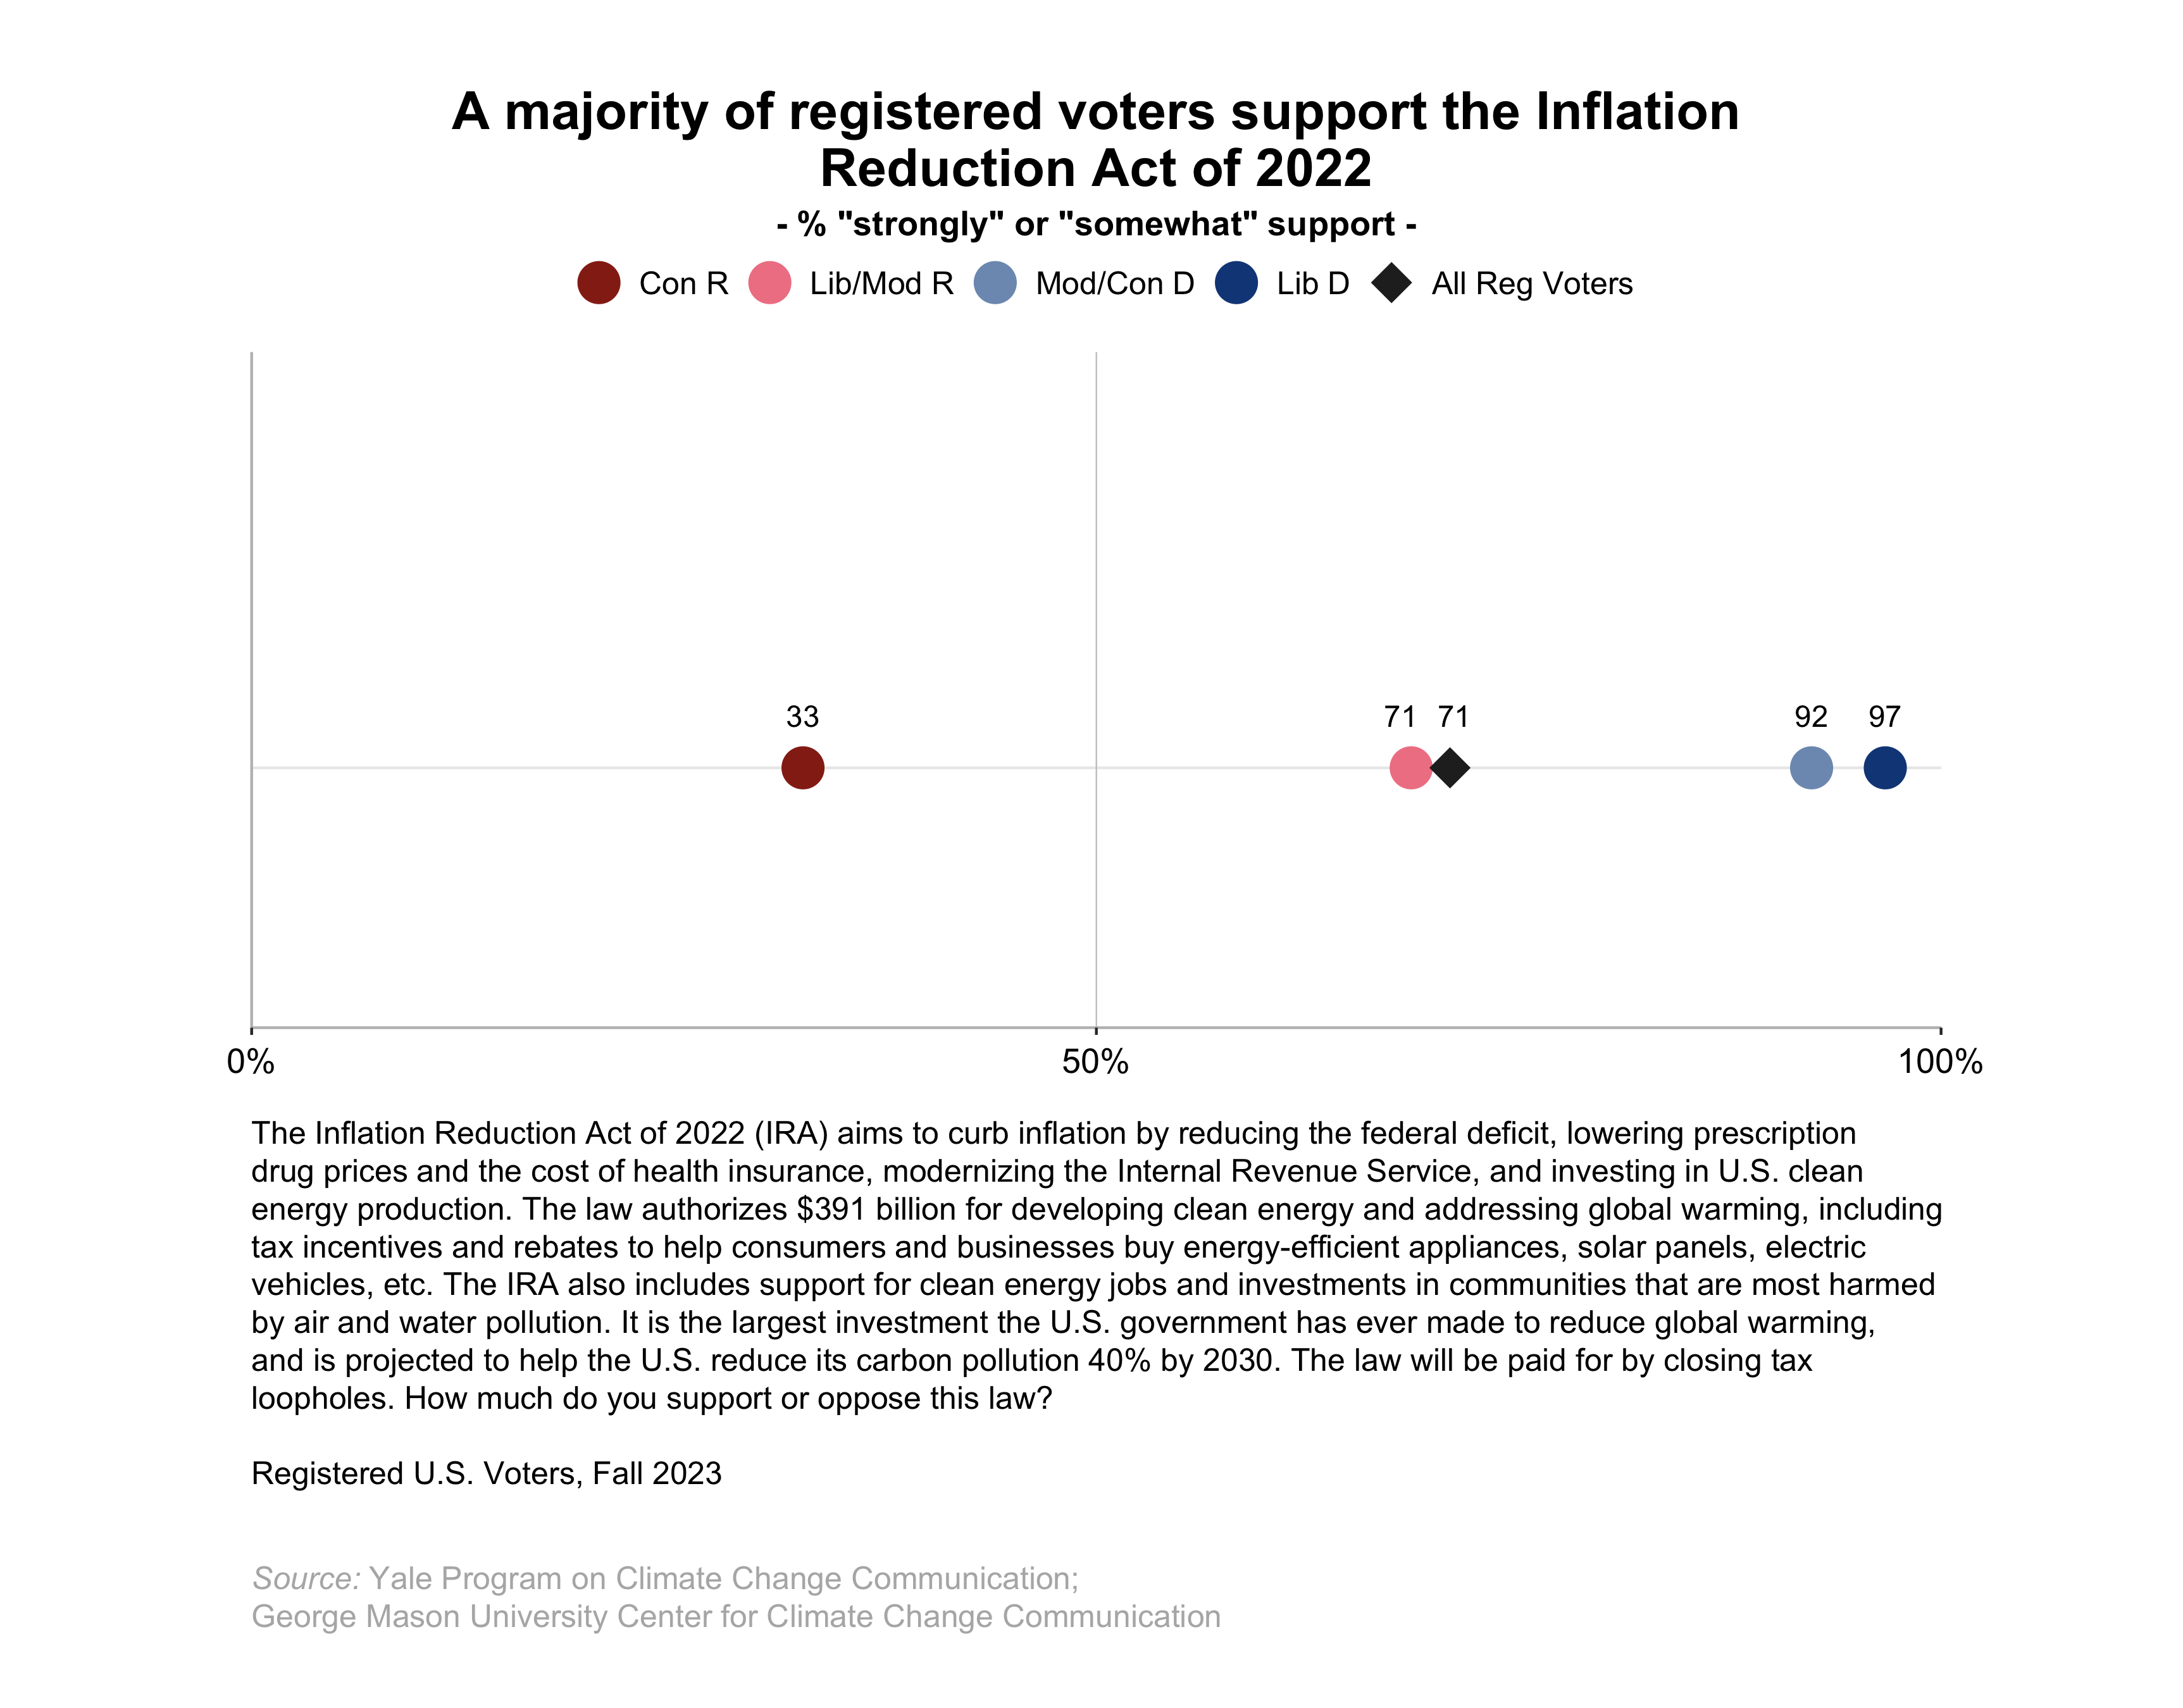
4.2. A majority of registered voters support the Inflation Reduction Act of 2022.
After reading a brief description of the Inflation Reduction Act (IRA), a large majority of registered voters (71%) say they support it (35% “strongly support” and 35% “somewhat support”; refer to data tables, p. 49). Nearly all liberal Democrats (97%) and a large majority of moderate/conservative Democrats (92%) support the IRA, as do about seven in ten liberal/moderate Republicans (71%; an increase of 14 percentage points since we last asked this question in Spring 2023). By contrast, one in three conservative Republicans support the IRA (33%), while 66% oppose it (including 43% who strongly oppose it).
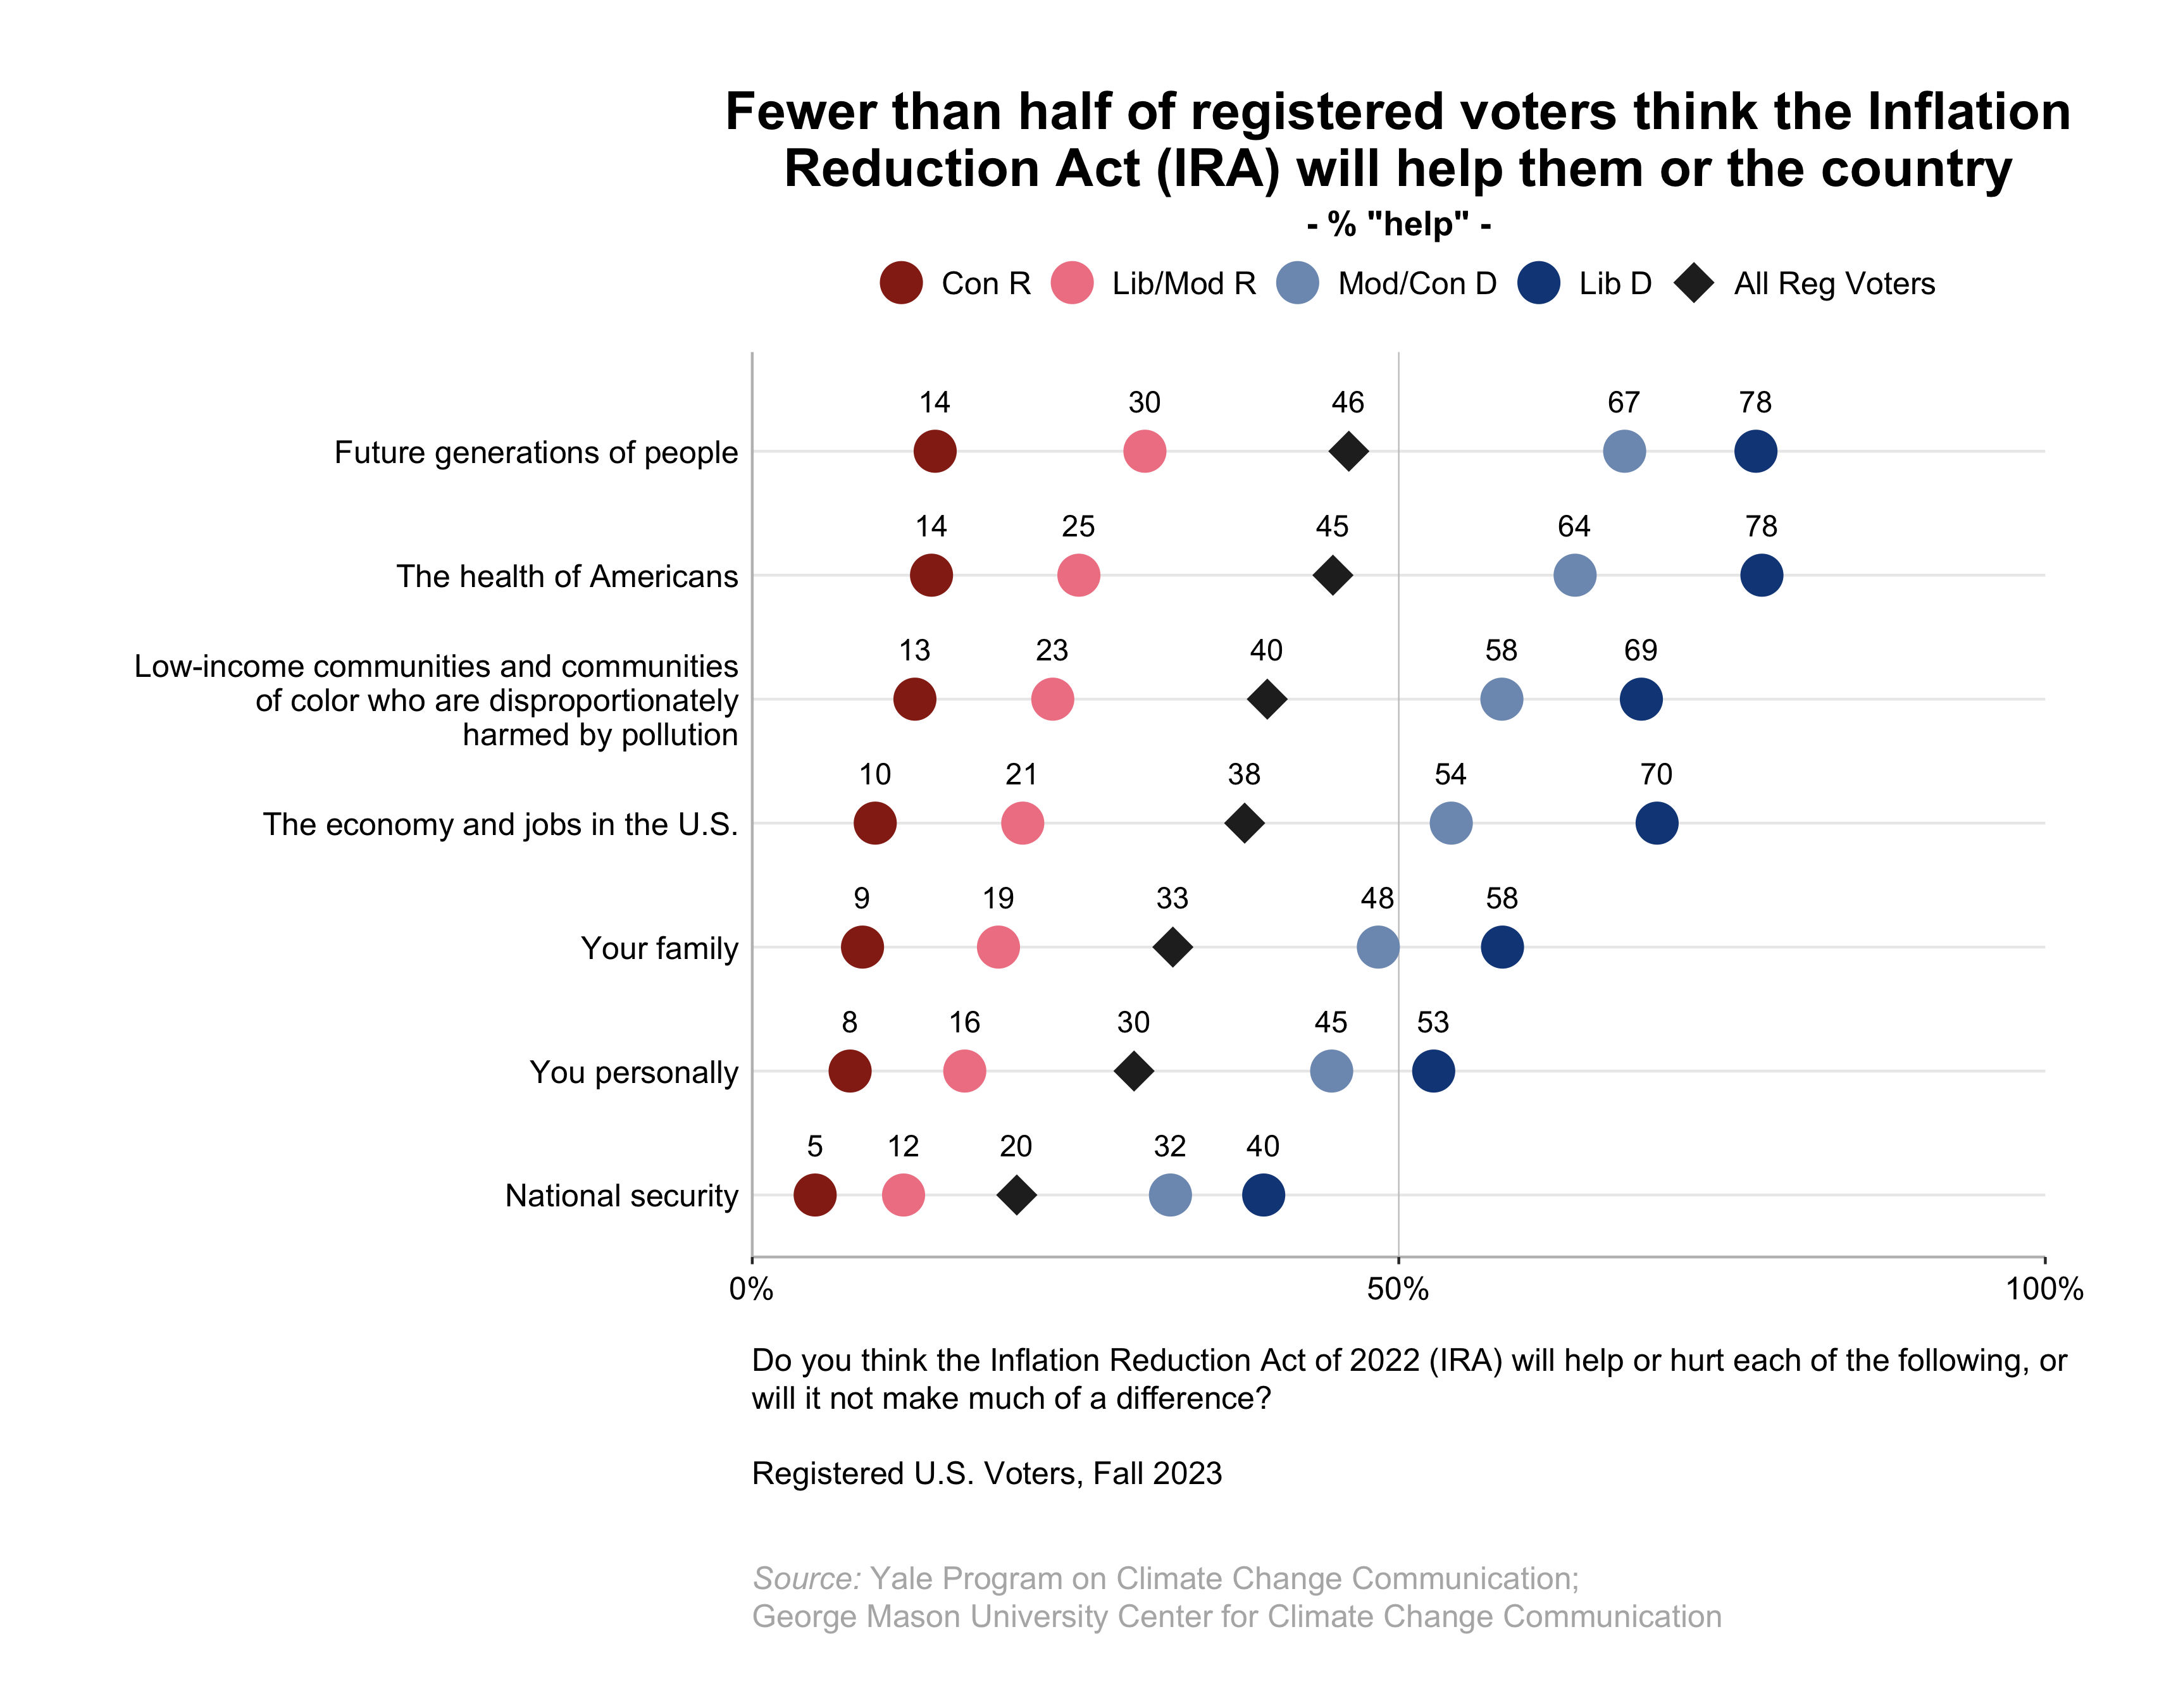
4.3. Fewer than half of registered voters think the Inflation Reduction Act (IRA) will help them or the country. However, some of these numbers have increased over the past year.
Fewer than half of registered voters think the Inflation Reduction Act (IRA) will help the following groups of people or the country, including:
- Future generations of people: 46% of registered voters; 78% of liberal Democrats, 67% of moderate/conservative Democrats, 30% of liberal/moderate Republicans, and 14% of conservative Republicans.
- The health of Americans: 45% of registered voters (an increase of 10 percentage points since we last asked this question in December 2022); 78% of liberal Democrats (+10 points), 64% of moderate/conservative Democrats (+15 points), 25% of liberal/moderate Republicans, and 14% of conservative Republicans (+8 points).
- Low-income communities and communities of color who are disproportionately harmed by pollution: 40% of registered voters; 69% of liberal Democrats, 58% of moderate/conservative Democrats, 23% of liberal/moderate Republicans, and 13% of conservative Republicans.
- The economy and jobs in the U.S.: 38% of registered voters; 70% of liberal Democrats, 54% of moderate/conservative Democrats, 21% of liberal/moderate Republicans, and 10% of conservative Republicans.
- Their family: 33% of registered voters (+7 percentage points since December 2022); 58% of liberal Democrats (+11 points), 48% of moderate/conservative Democrats, 19% of liberal/moderate Republicans (+10 points), and 9% of conservative Republicans.
- Them personally: 30% of registered voters (+8 percentage points since December 2022); 53% of liberal Democrats (+12 points), 45% of moderate/conservative Democrats (+11 points), 16% of liberal/moderate Republicans (+9 points), and 8% of conservative Republicans.
- National security: 20% of registered voters; 40% of liberal Democrats, 32% of moderate/conservative Democrats, 12% of liberal/moderate Republicans, and 5% of conservative Republicans.
5. Energy Production as an Economic Issue
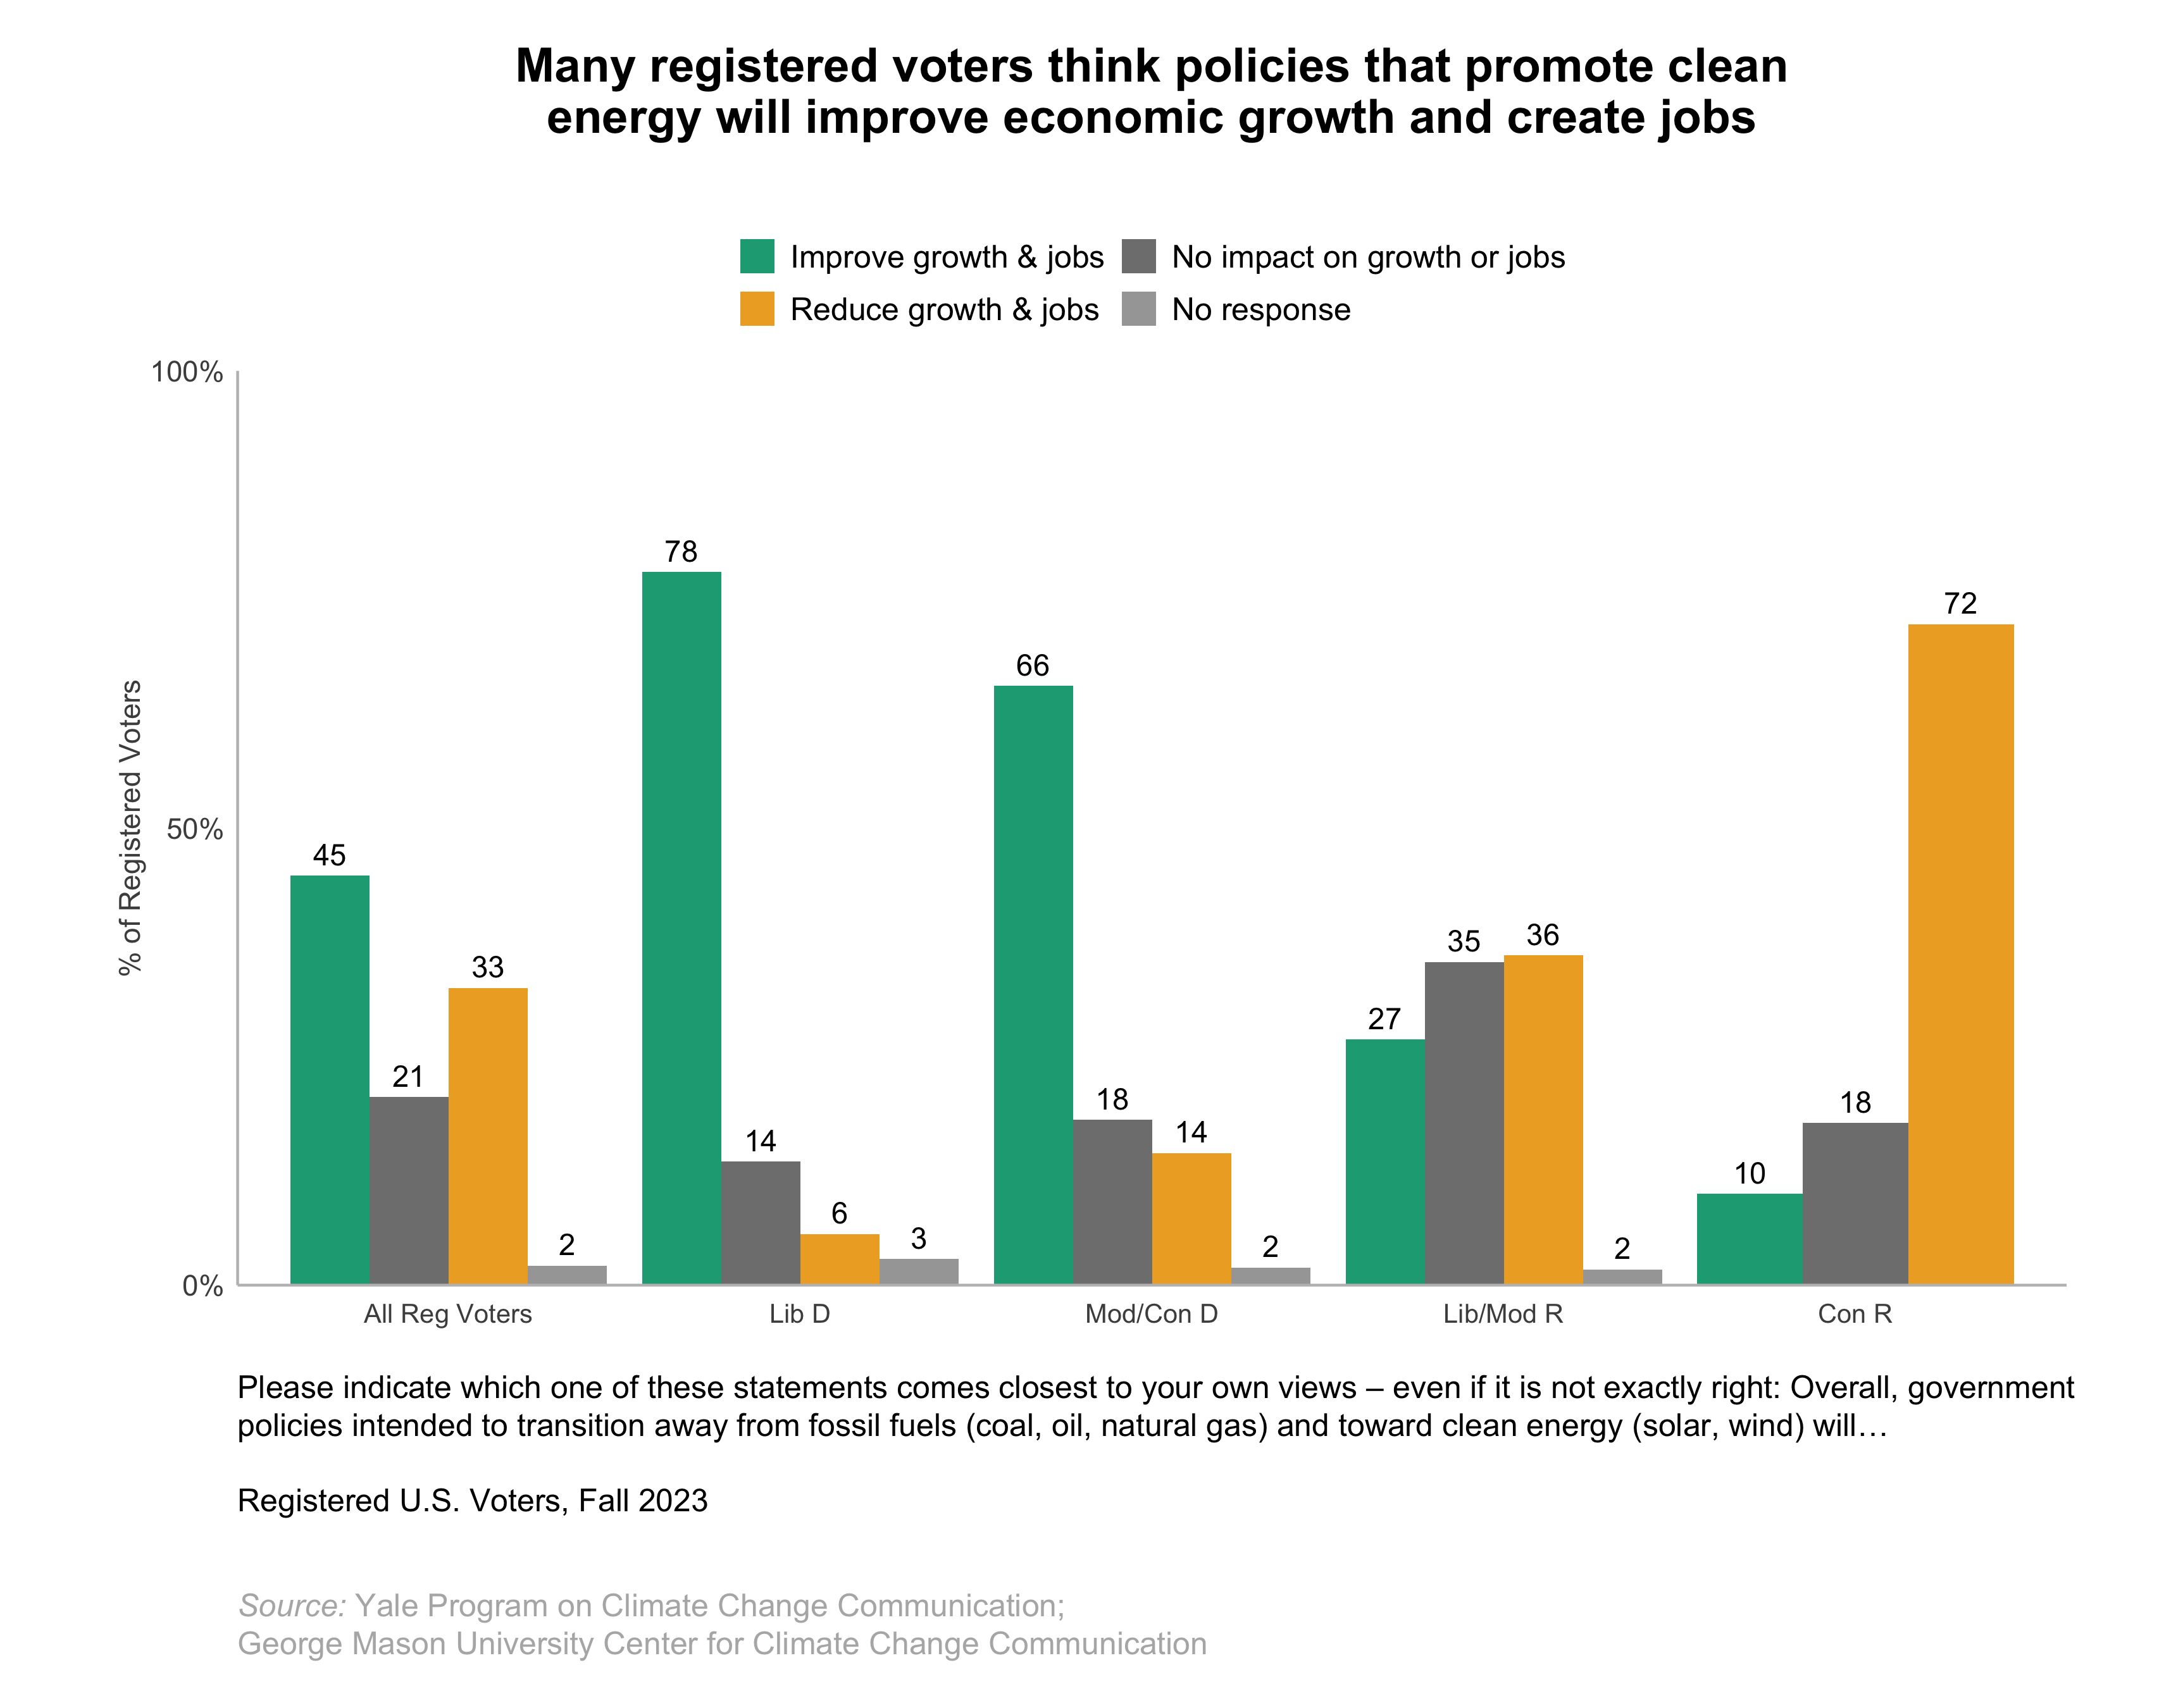
5.1. Many registered voters think policies that promote clean energy will improve economic growth and create jobs.
A plurality of registered voters (45%) think policies that promote clean energy will improve economic growth and create jobs, while one in three (33%) think it will have the opposite effect, reducing growth and costing jobs, and 21% think it will have no impact either way.1
Opinion is sharply divided along political lines; majorities of liberal Democrats (78%) and moderate/conservative Democrats (66%) think clean energy policies will have a positive impact on the economy and jobs. By contrast, more liberal/moderate Republicans think such policies will have a negative impact (36%) than a positive impact (27%), and about seven in ten conservative Republicans (72%) think the policies will have a negative impact.
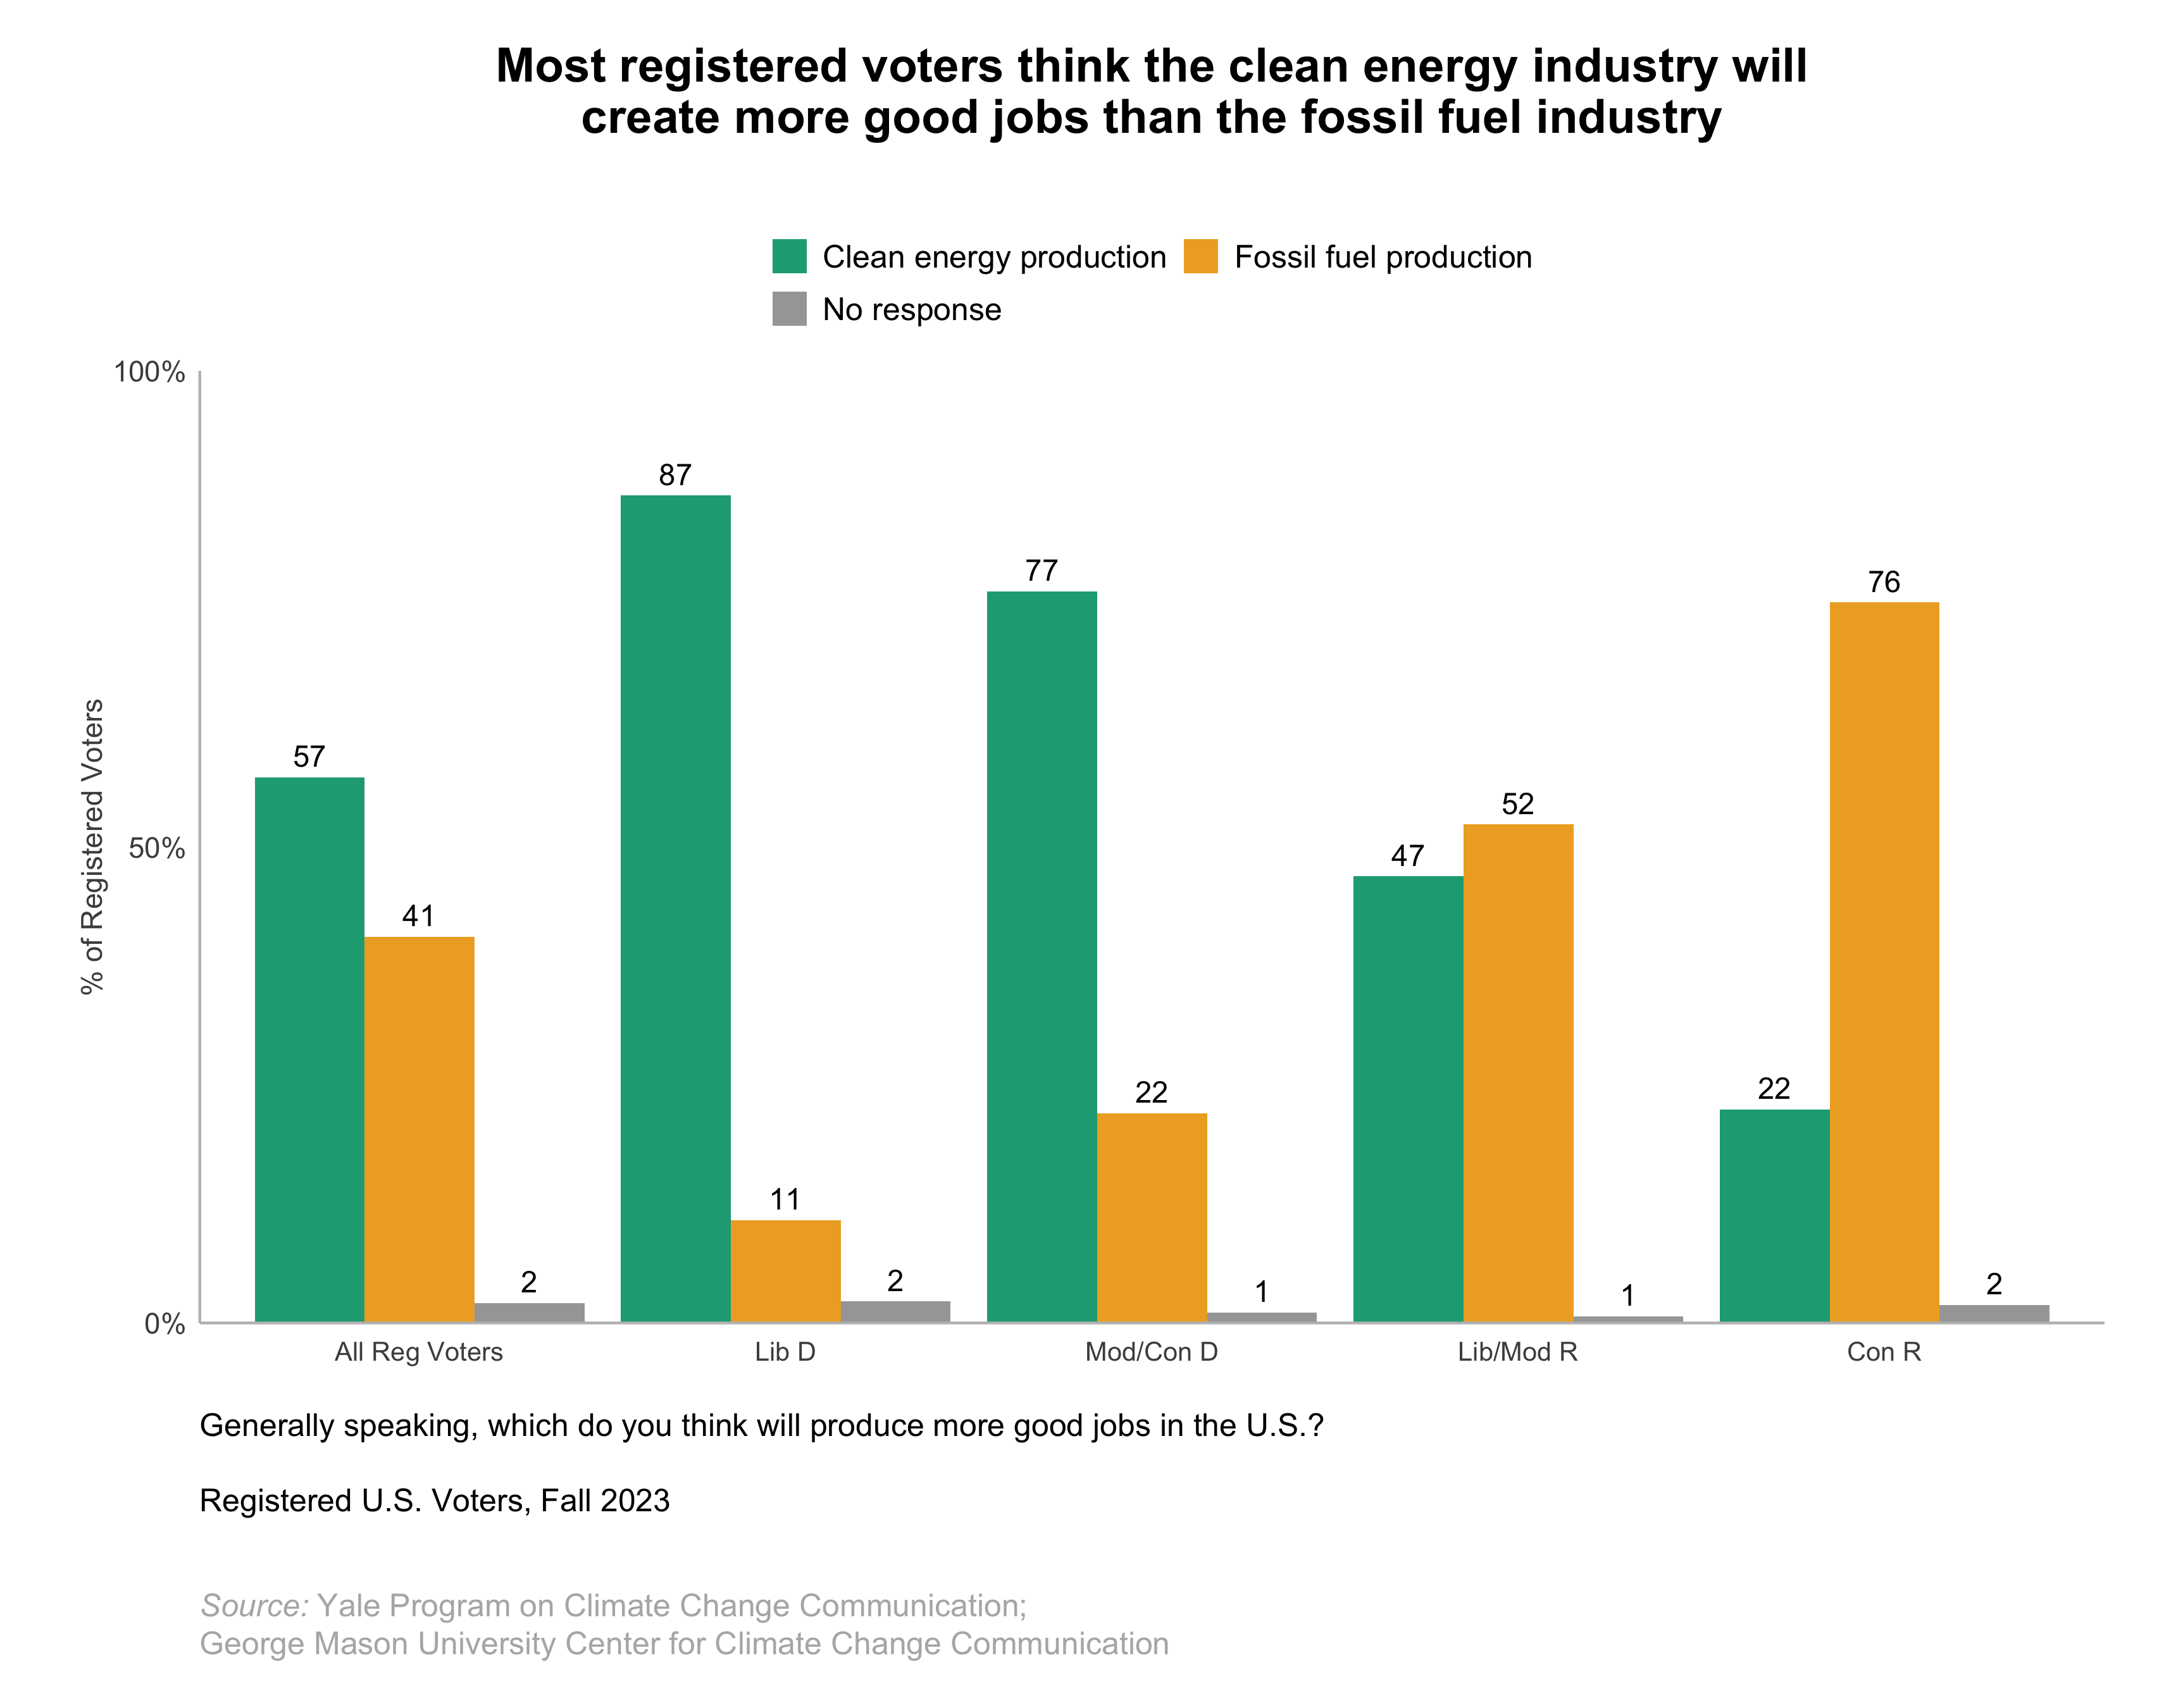
5.2. Most registered voters think the clean energy industry will create more good jobs than the fossil fuel industry.
More than half of registered voters (57%) think increasing production of clean energy in the U.S. will produce more new jobs than increasing fossil fuel production, while 41% think the opposite (that increasing fossil fuel production will create more jobs than increasing clean energy production).2
Large majorities of liberal Democrats (87%) and moderate/conservative Democrats (77%) think clean energy production will produce more good jobs. In contrast, about half of liberal/moderate Republicans (52%) and about three in four conservative Republicans (76%) think increasing fossil fuel production will create more good U.S. jobs.
6. Who Should Take Action to Address Global Warming?
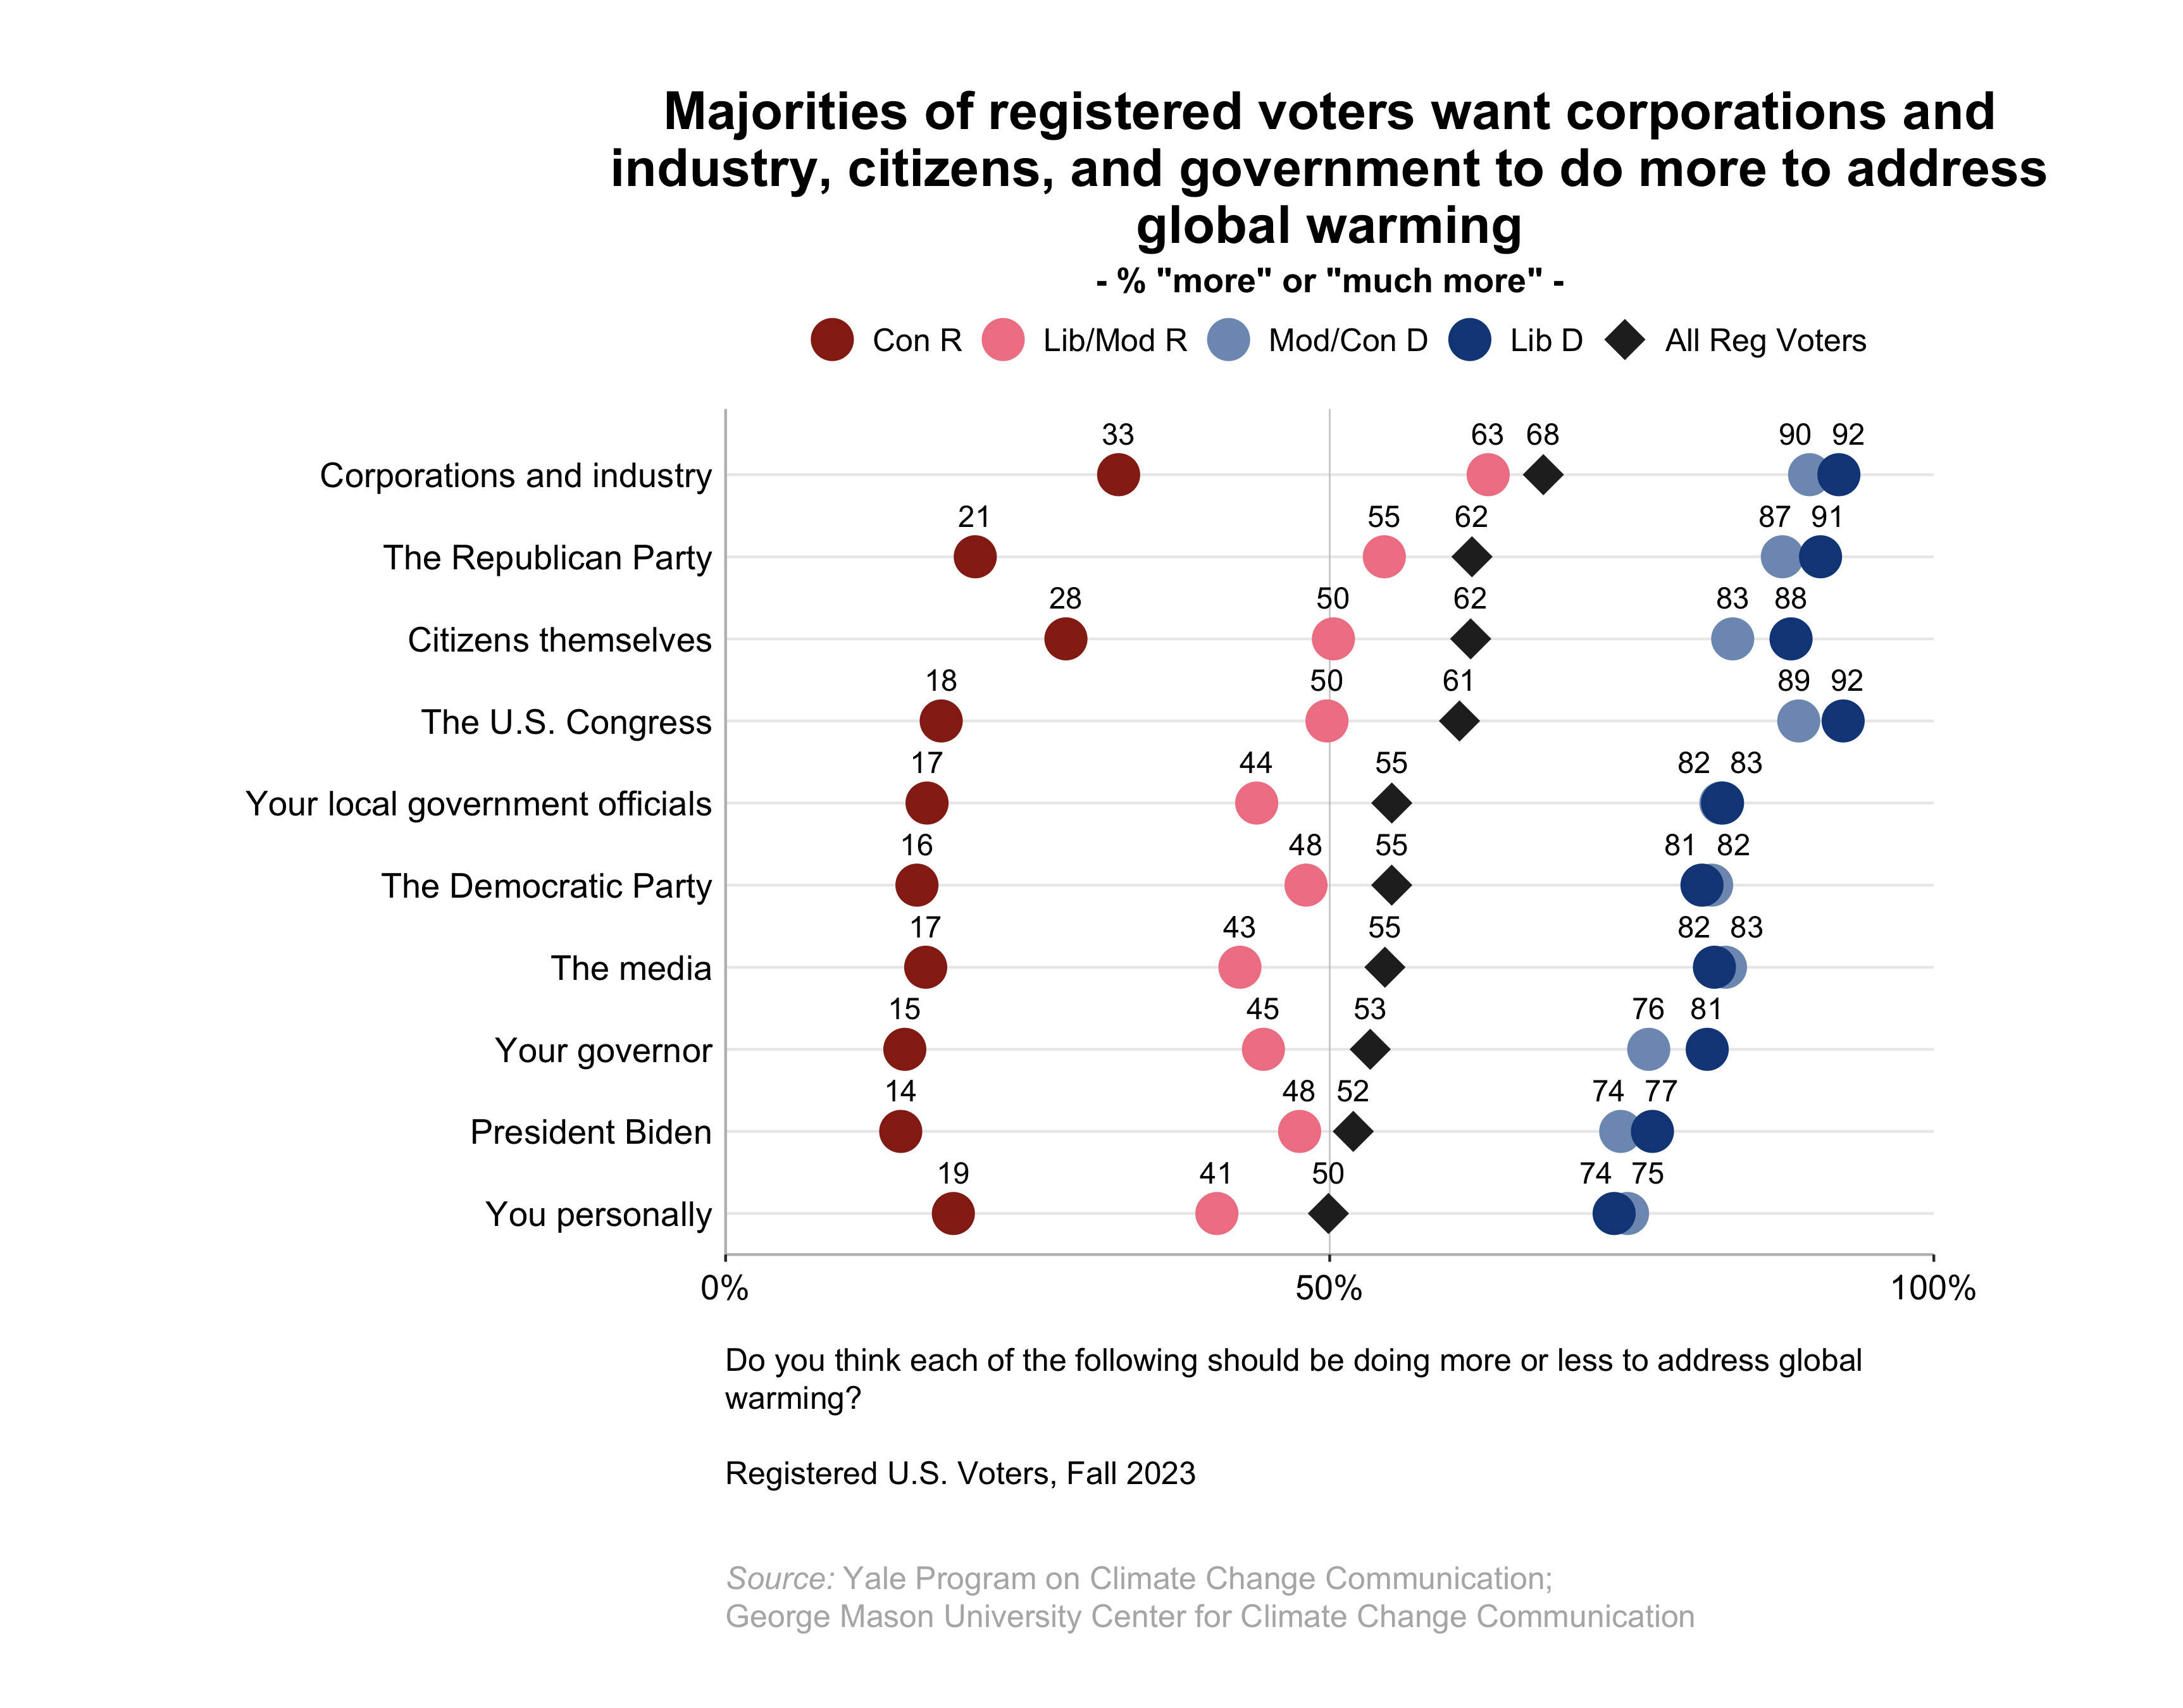
6.1. Majorities of registered voters want corporations and industry, citizens, and government to do more to address global warming.
A majority of registered voters say corporations and industry should do either “much more” or “more” to address global warming (68% of registered voters, including 92% of liberal Democrats, 90% of moderate/conservative Democrats, 63% of liberal/moderate Republicans, and 33% of conservative Republicans).
Half or more of registered voters, including majorities of both liberal and moderate/conservative Democrats and about half of liberal/moderate Republicans, say the Republican Party (62%), citizens themselves (62%), and the U.S. Congress (61%) should do more. Half or more of registered voters, including majorities of both liberal and moderate/conservative Democrats, say their local government officials (55%), the Democratic Party (55%), the media (55%), their governor (53%), President Biden (52%), and they themselves (50%) should do more to address global warming.
About half of liberal/moderate Republicans (55%) say their party (the Republican Party) should do more to address global warming, while only 21% of conservative Republicans say so. Majorities of both liberal Democrats (81%) and moderate/conservative Democrats (82%; an increase of 20 percentage points since we last asked this question in April 2023) say their party (the Democratic Party) should do more.
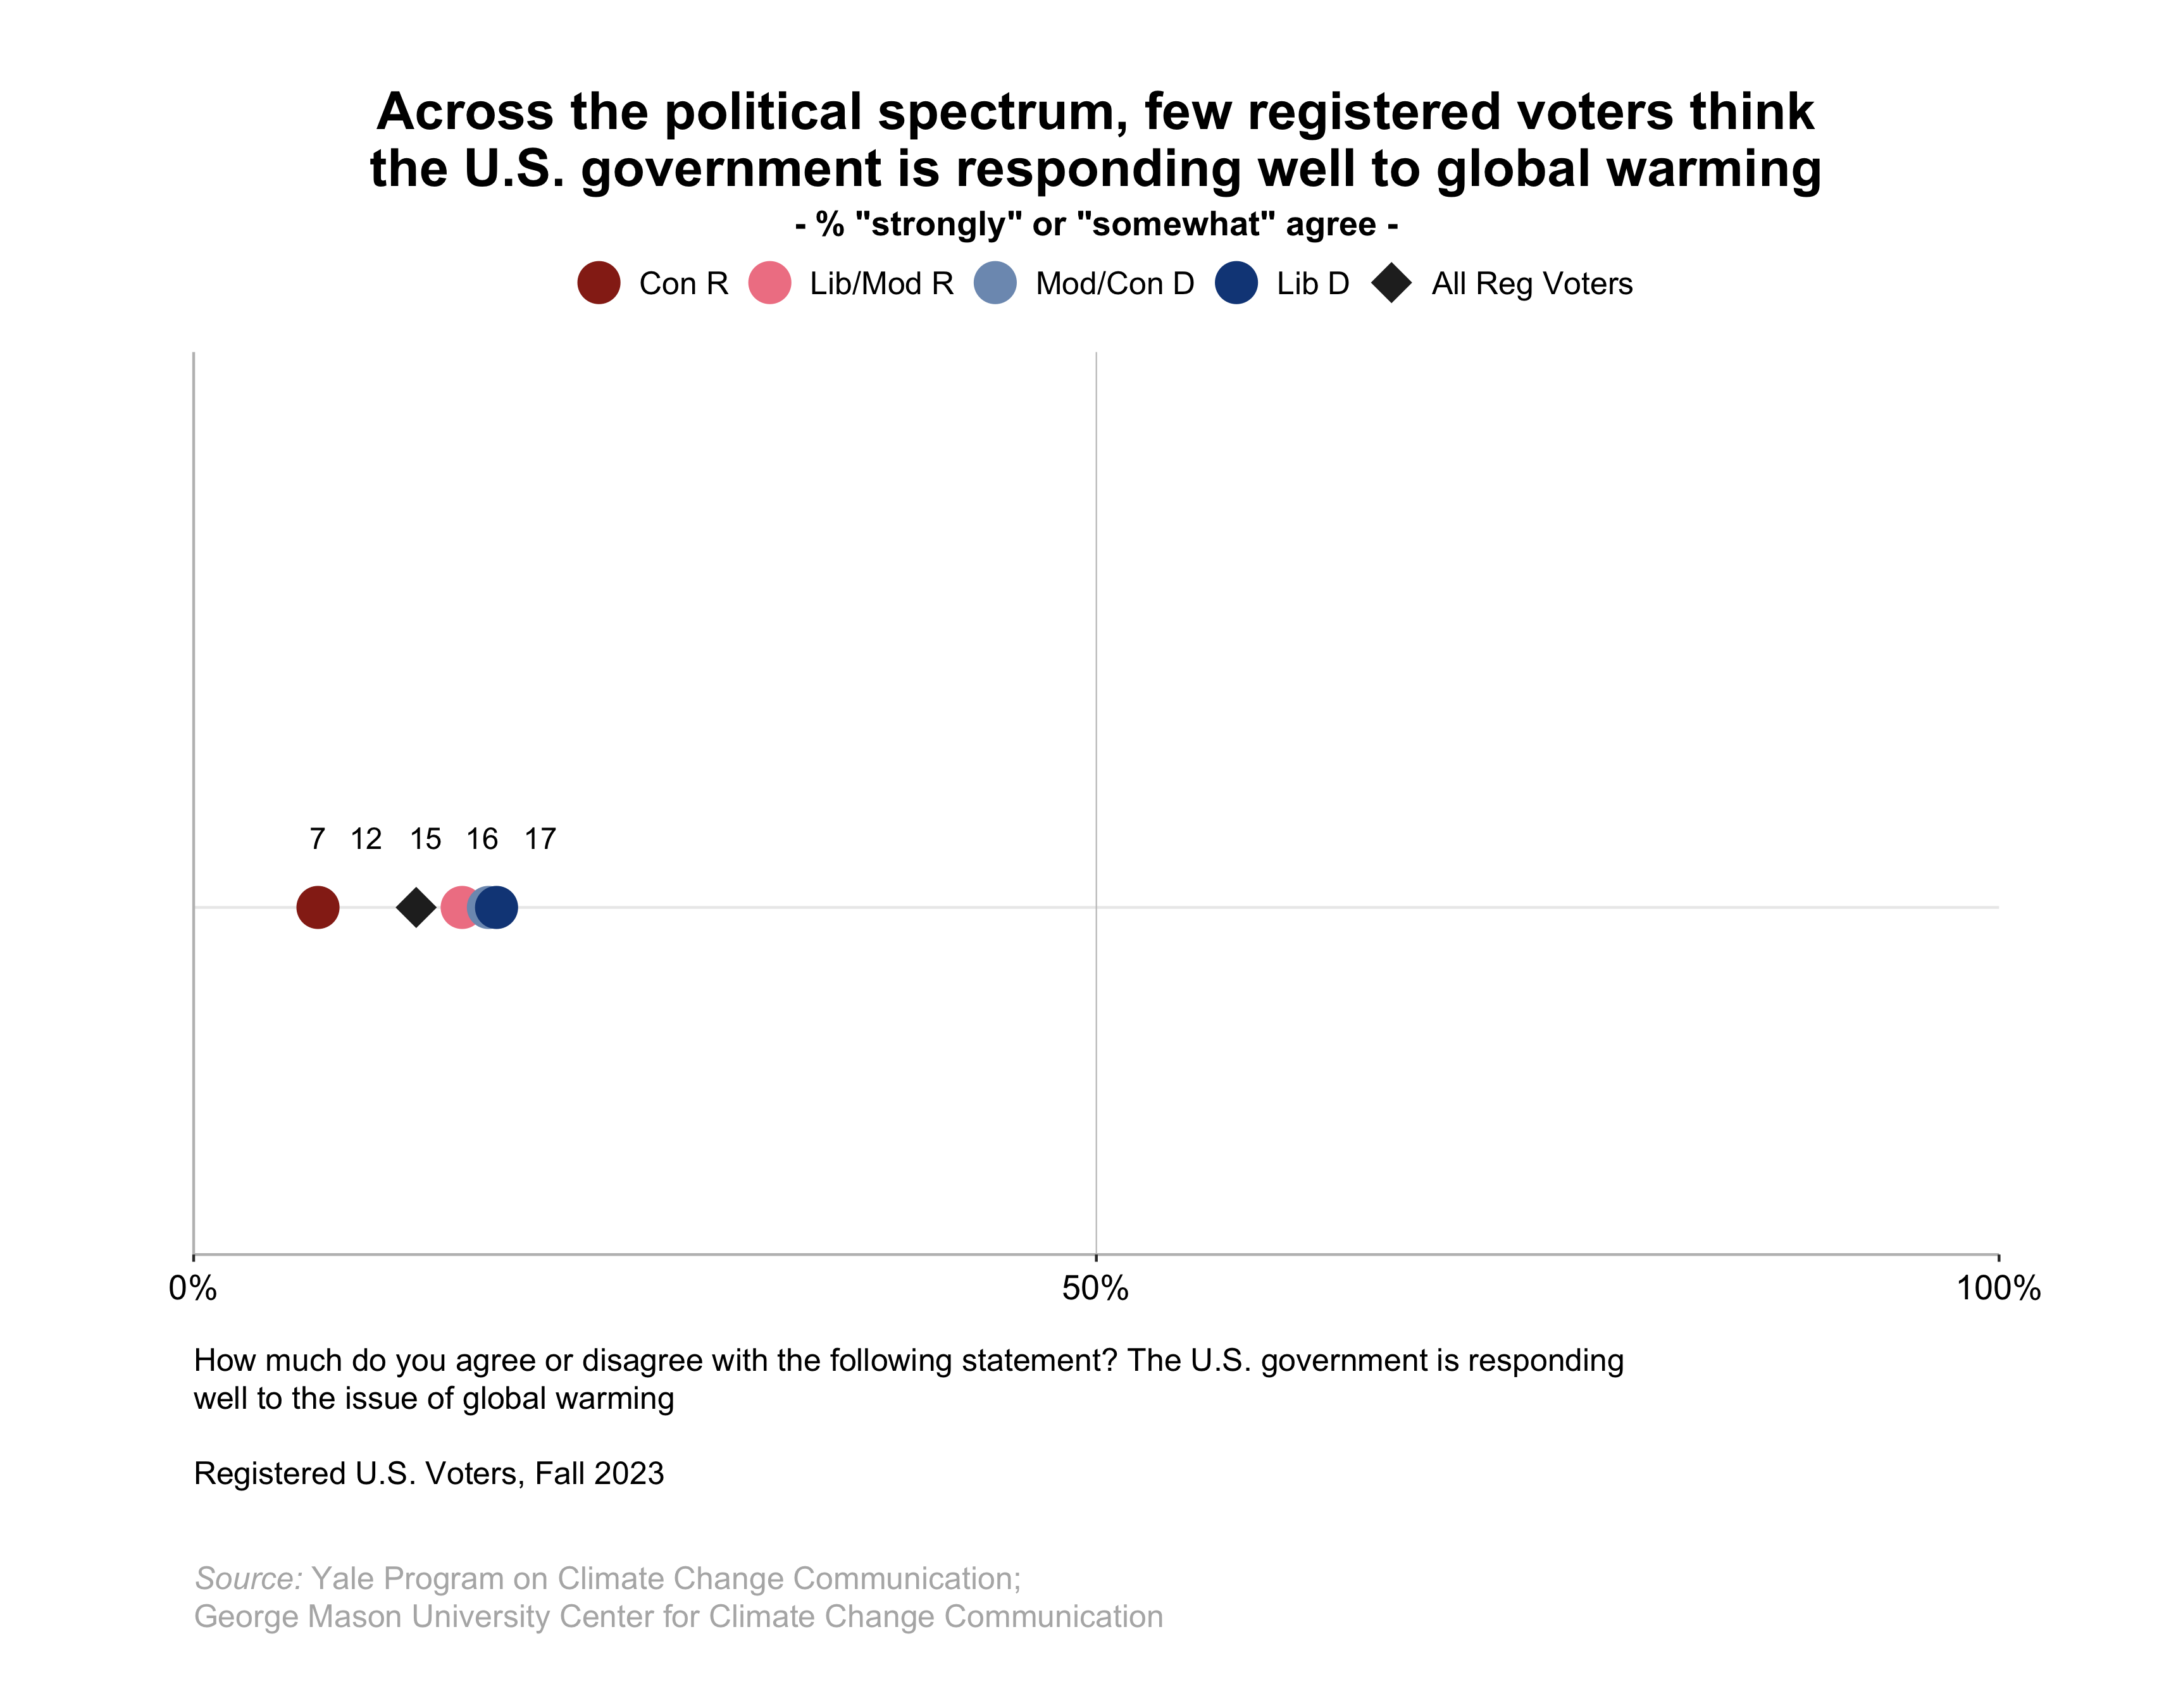
6.2. Across the political spectrum, few registered voters think the U.S. government is responding well to global warming.
Few registered voters agree that the U.S. government is responding well to the issue of global warming (12%). This is true across the political spectrum: Only 17% of liberal Democrats, 16% of moderate/conservative Democrats, 15% of liberal/moderate Republicans, and 7% of conservative Republicans agree.
7. Participation of the United States in International Climate Action
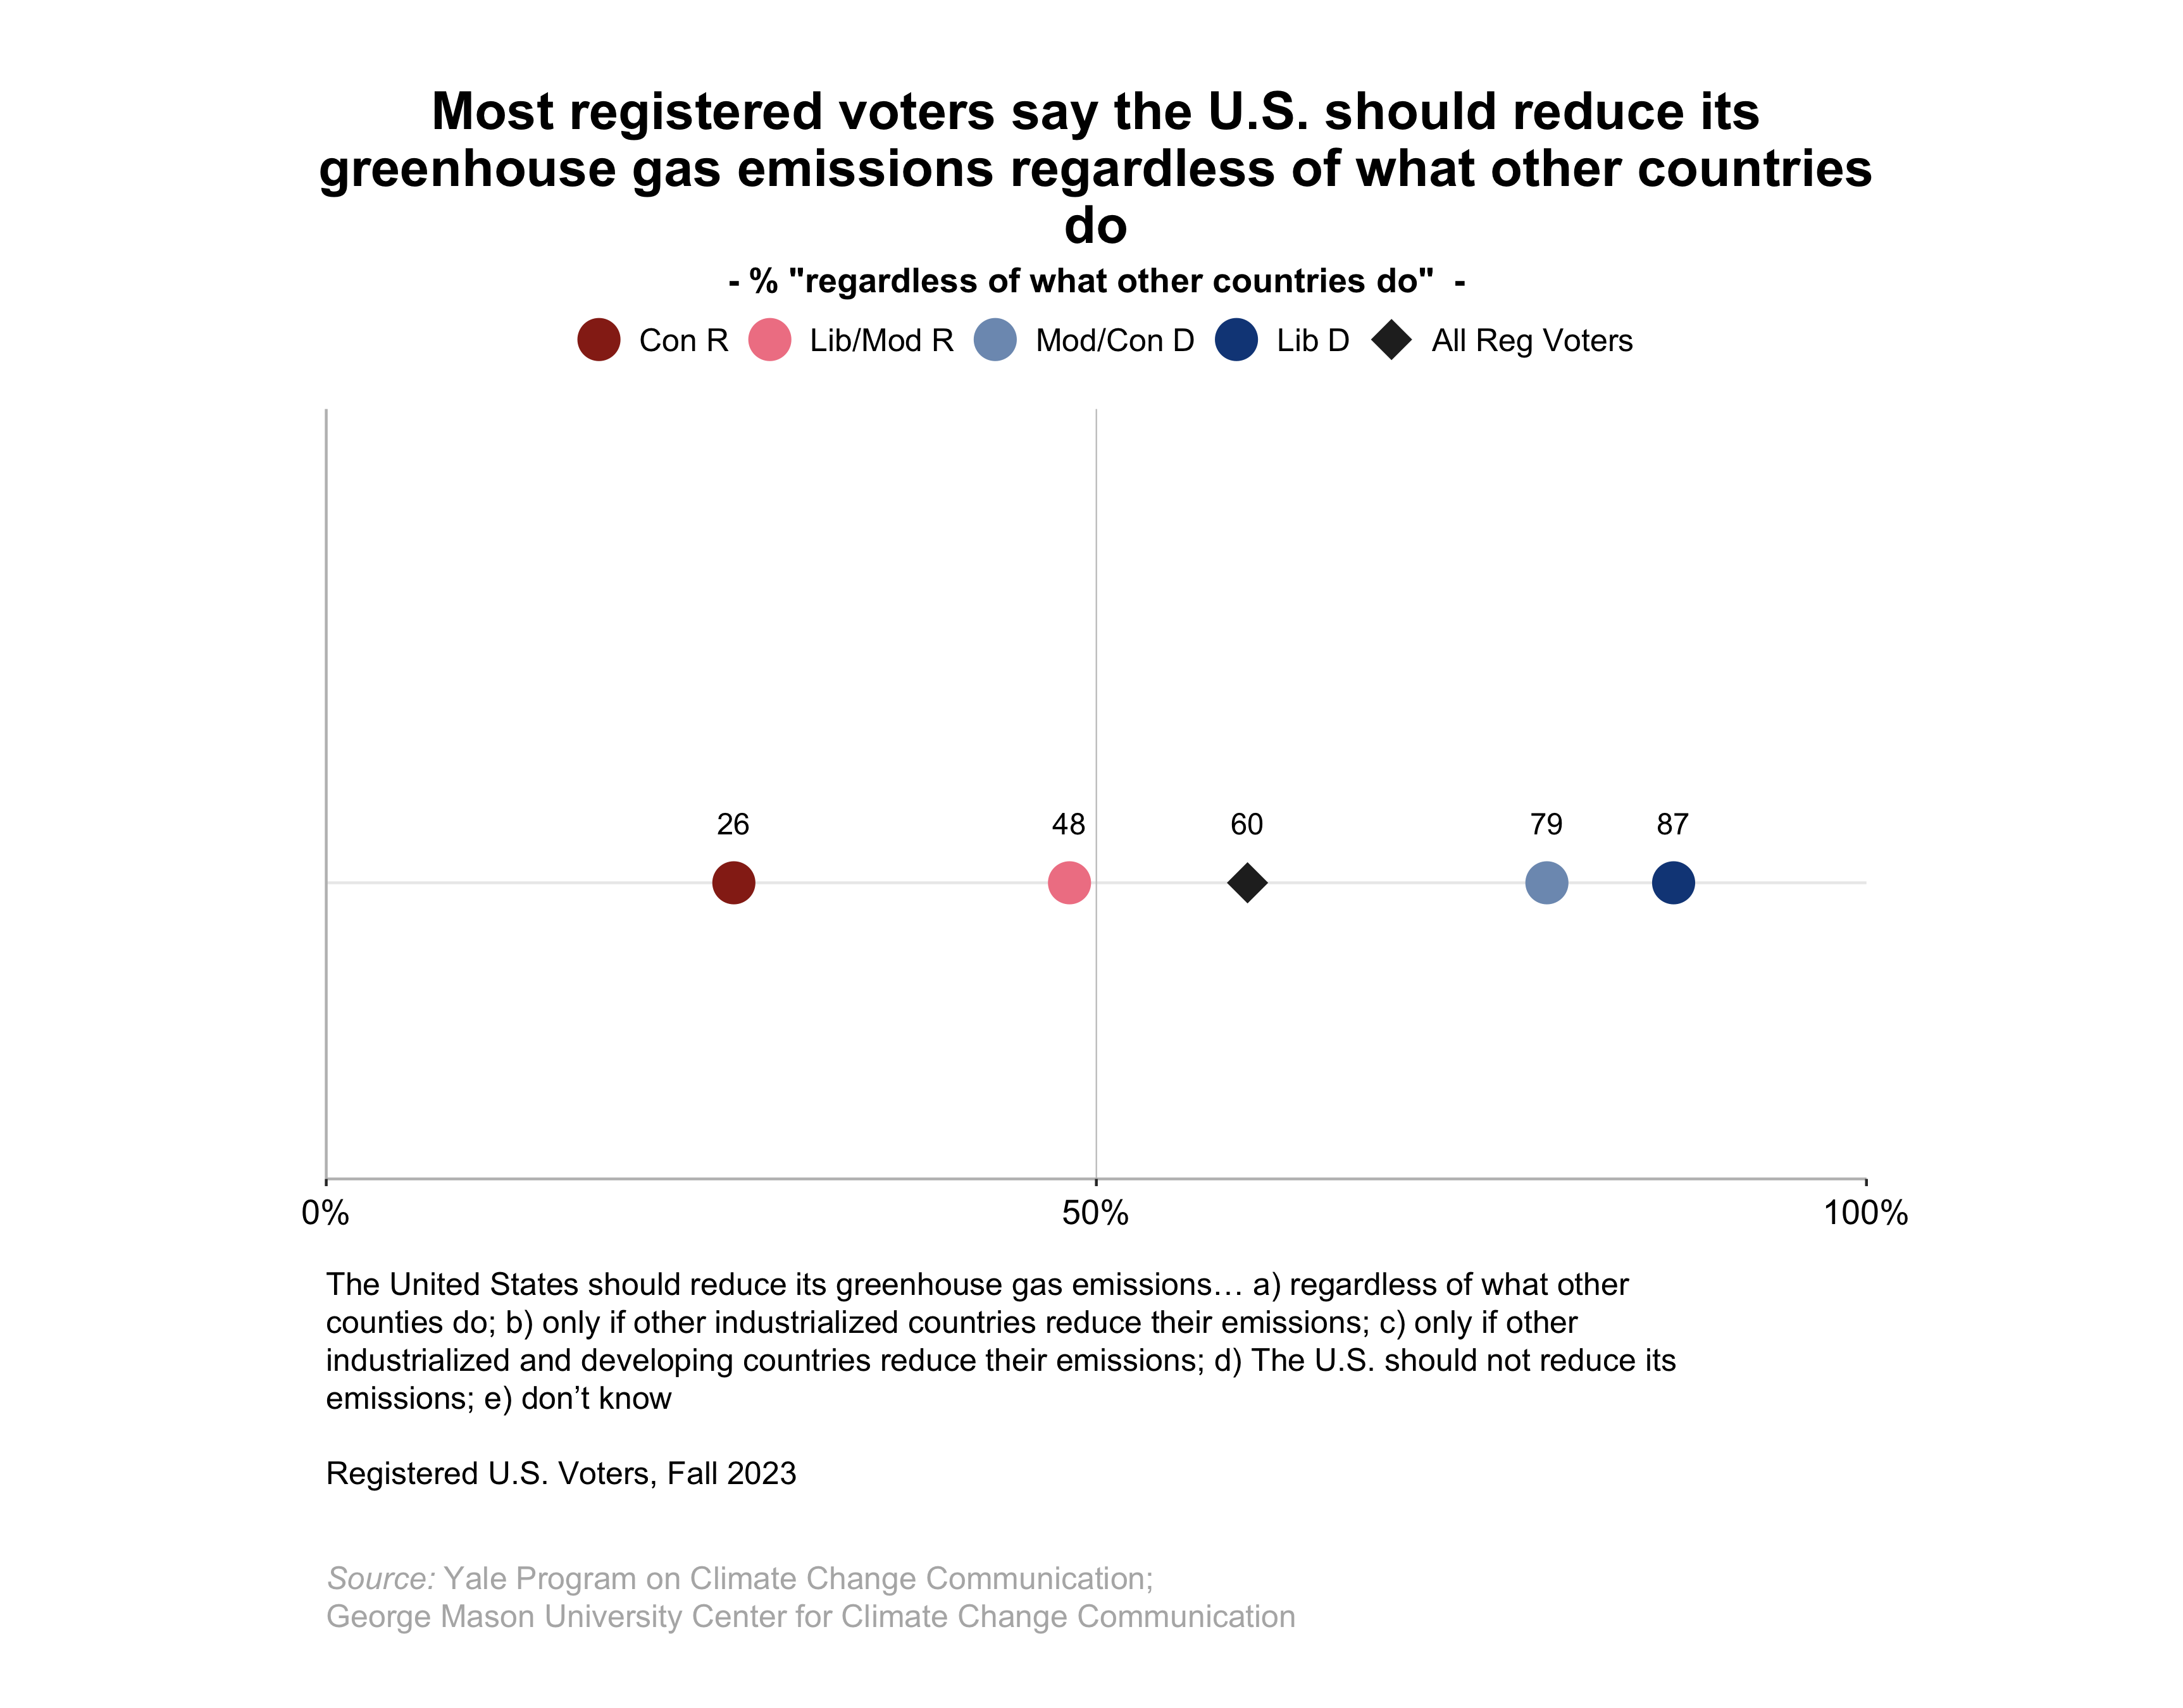
7.1. Most registered voters say the U.S. should reduce its greenhouse gas emissions regardless of what other countries do.
A majority of registered voters (60%) think the United States should reduce its greenhouse gas emissions, regardless of what other countries do. Majorities of liberal Democrats (87%) and moderate/conservative Democrats (79%), and about half of liberal/moderate Republicans (48%), but fewer conservative Republicans (26%), take this position.
Only 7% of registered voters (1% of Democrats, 8% of Independents, and 13% of Republicans) say the United States should not reduce its emissions (refer to data tables, p. 56).
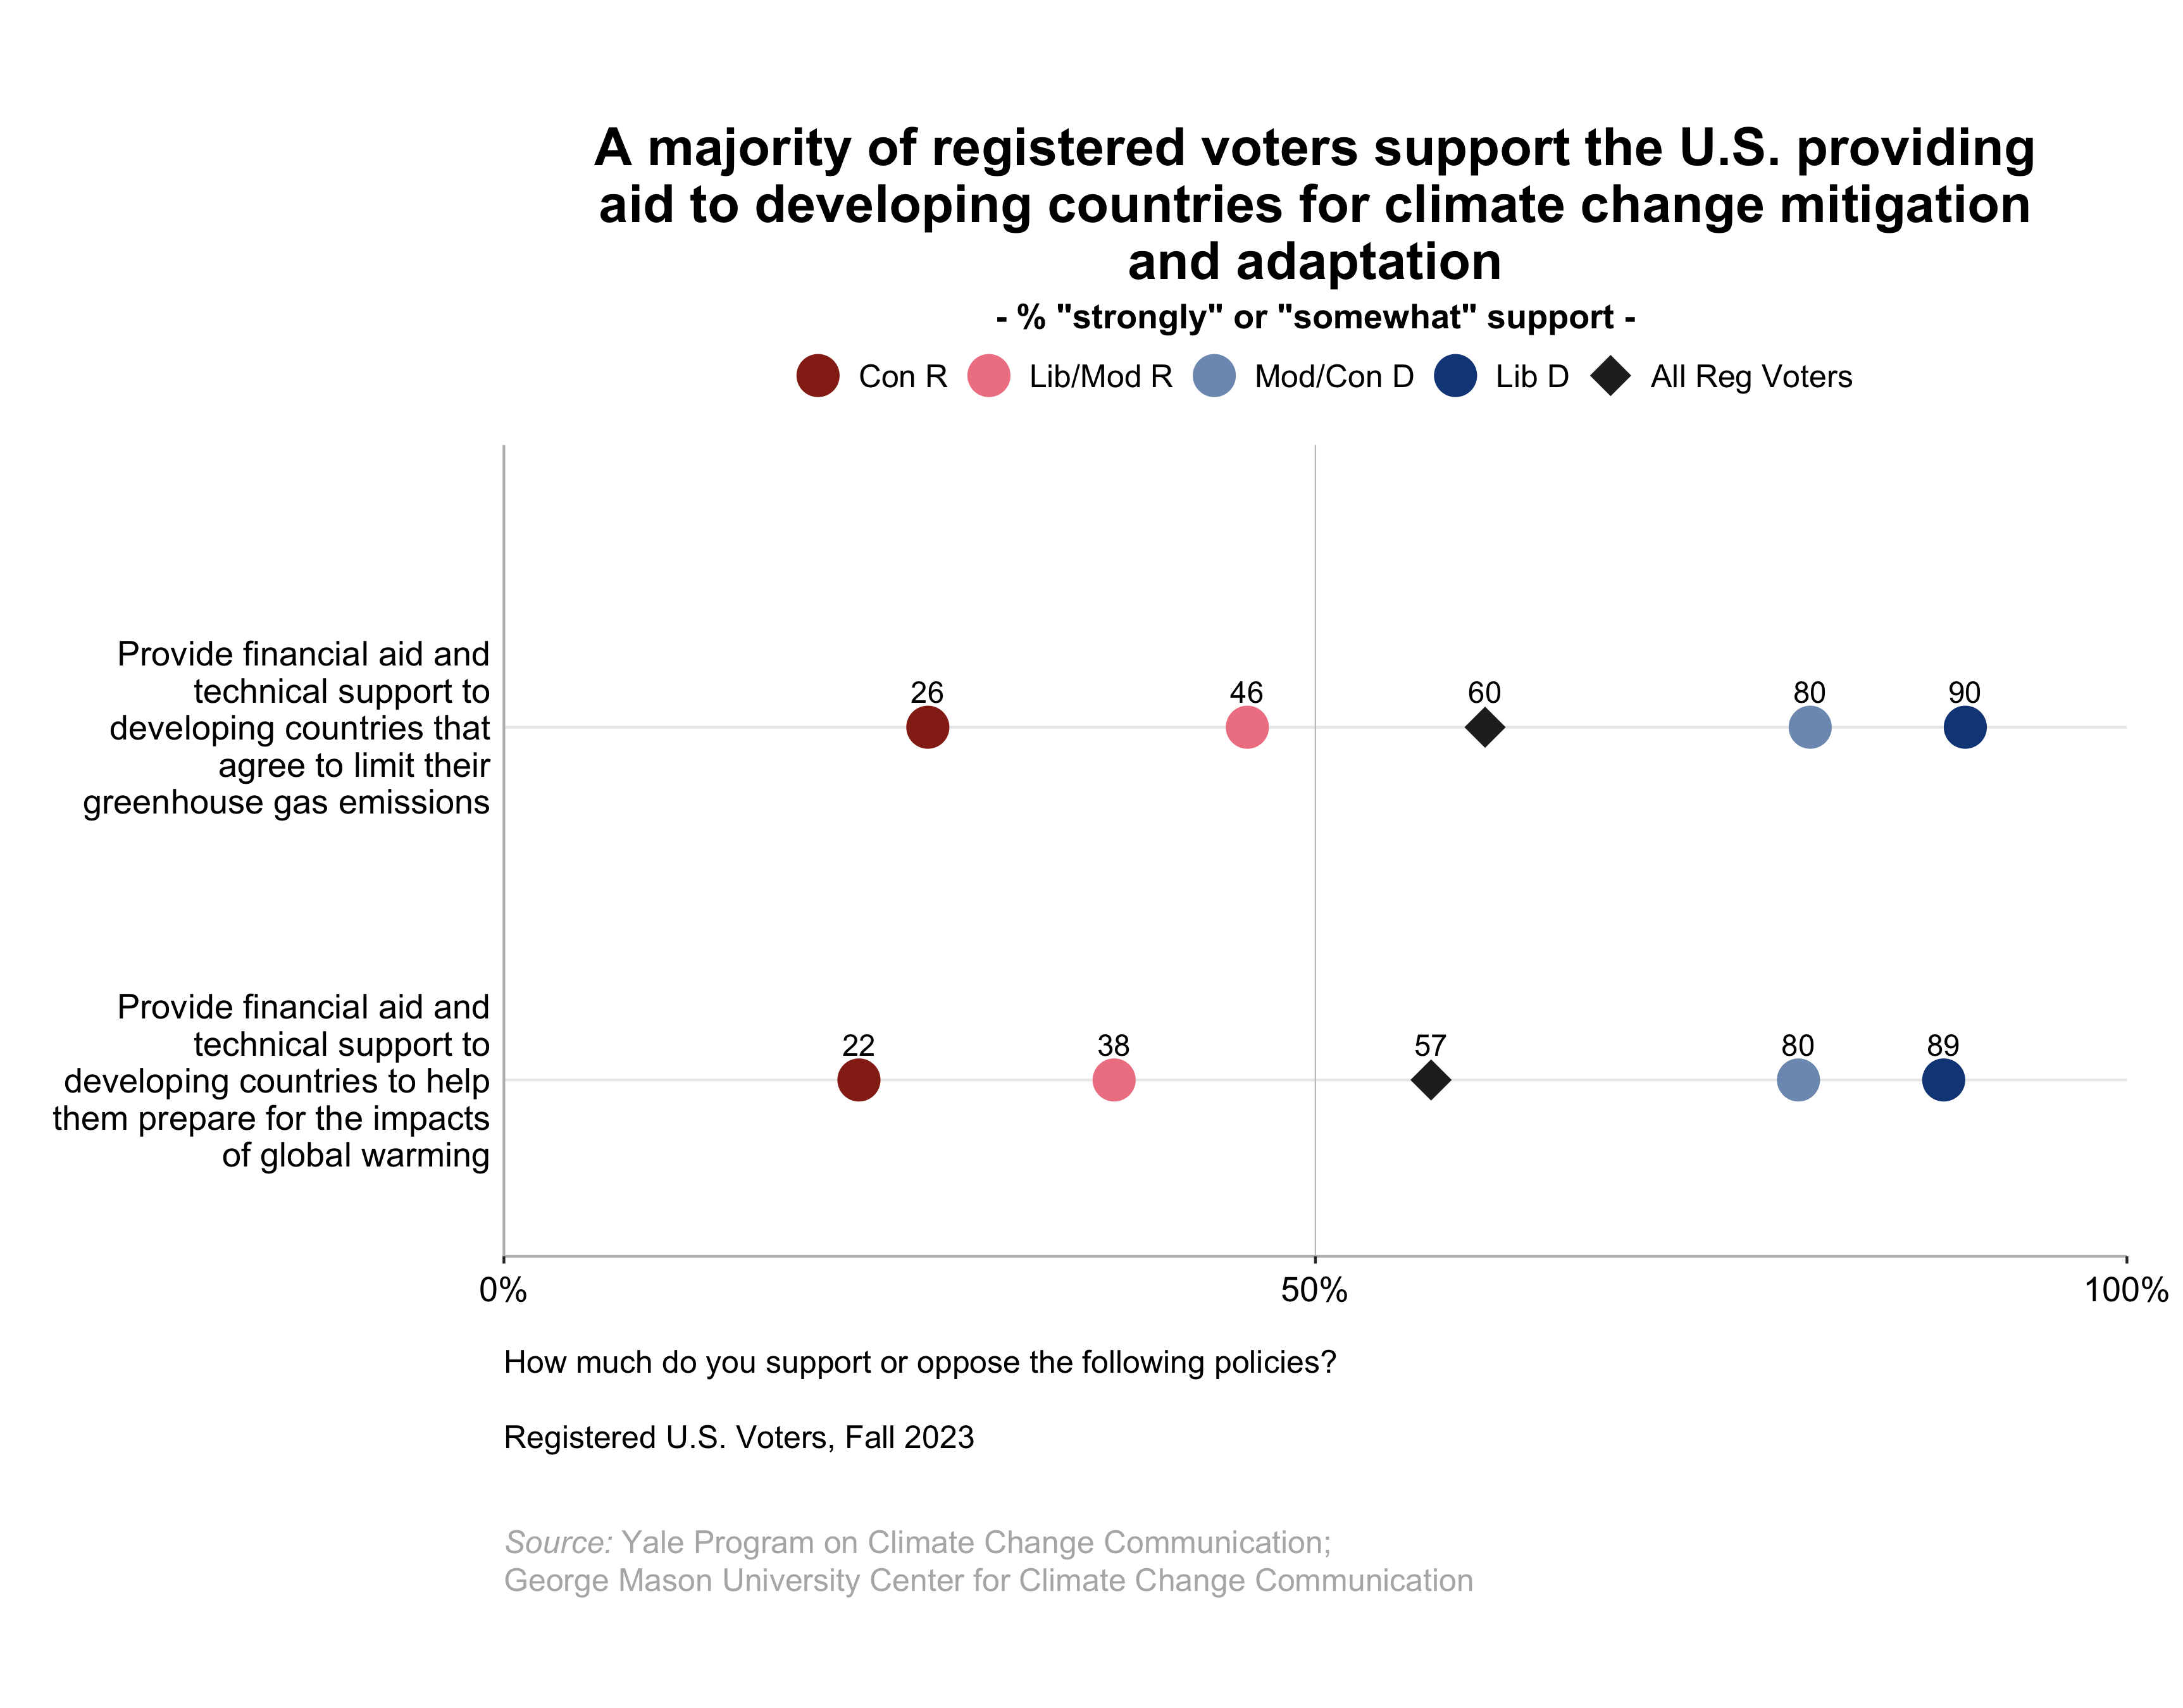
7.2. A majority of registered voters support the U.S. providing aid to developing countries for climate change mitigation and adaptation.
Majorities of registered voters support providing financial aid and technical support to developing countries to limit their greenhouse gas emissions (i.e., mitigation, 60%) and to help them prepare for the impacts of global warming (i.e., adaptation, 57%).
Large majorities of liberal Democrats support providing aid for mitigation (90%) and adaptation (89%), as do large majorities of moderate/conservative Democrats (mitigation, 80%; adaptation, 80%). Fewer liberal/moderate Republicans (mitigation, 46%; adaptation, 38%) and conservative Republicans (mitigation, 26%; adaptation, 22%) support these policies.
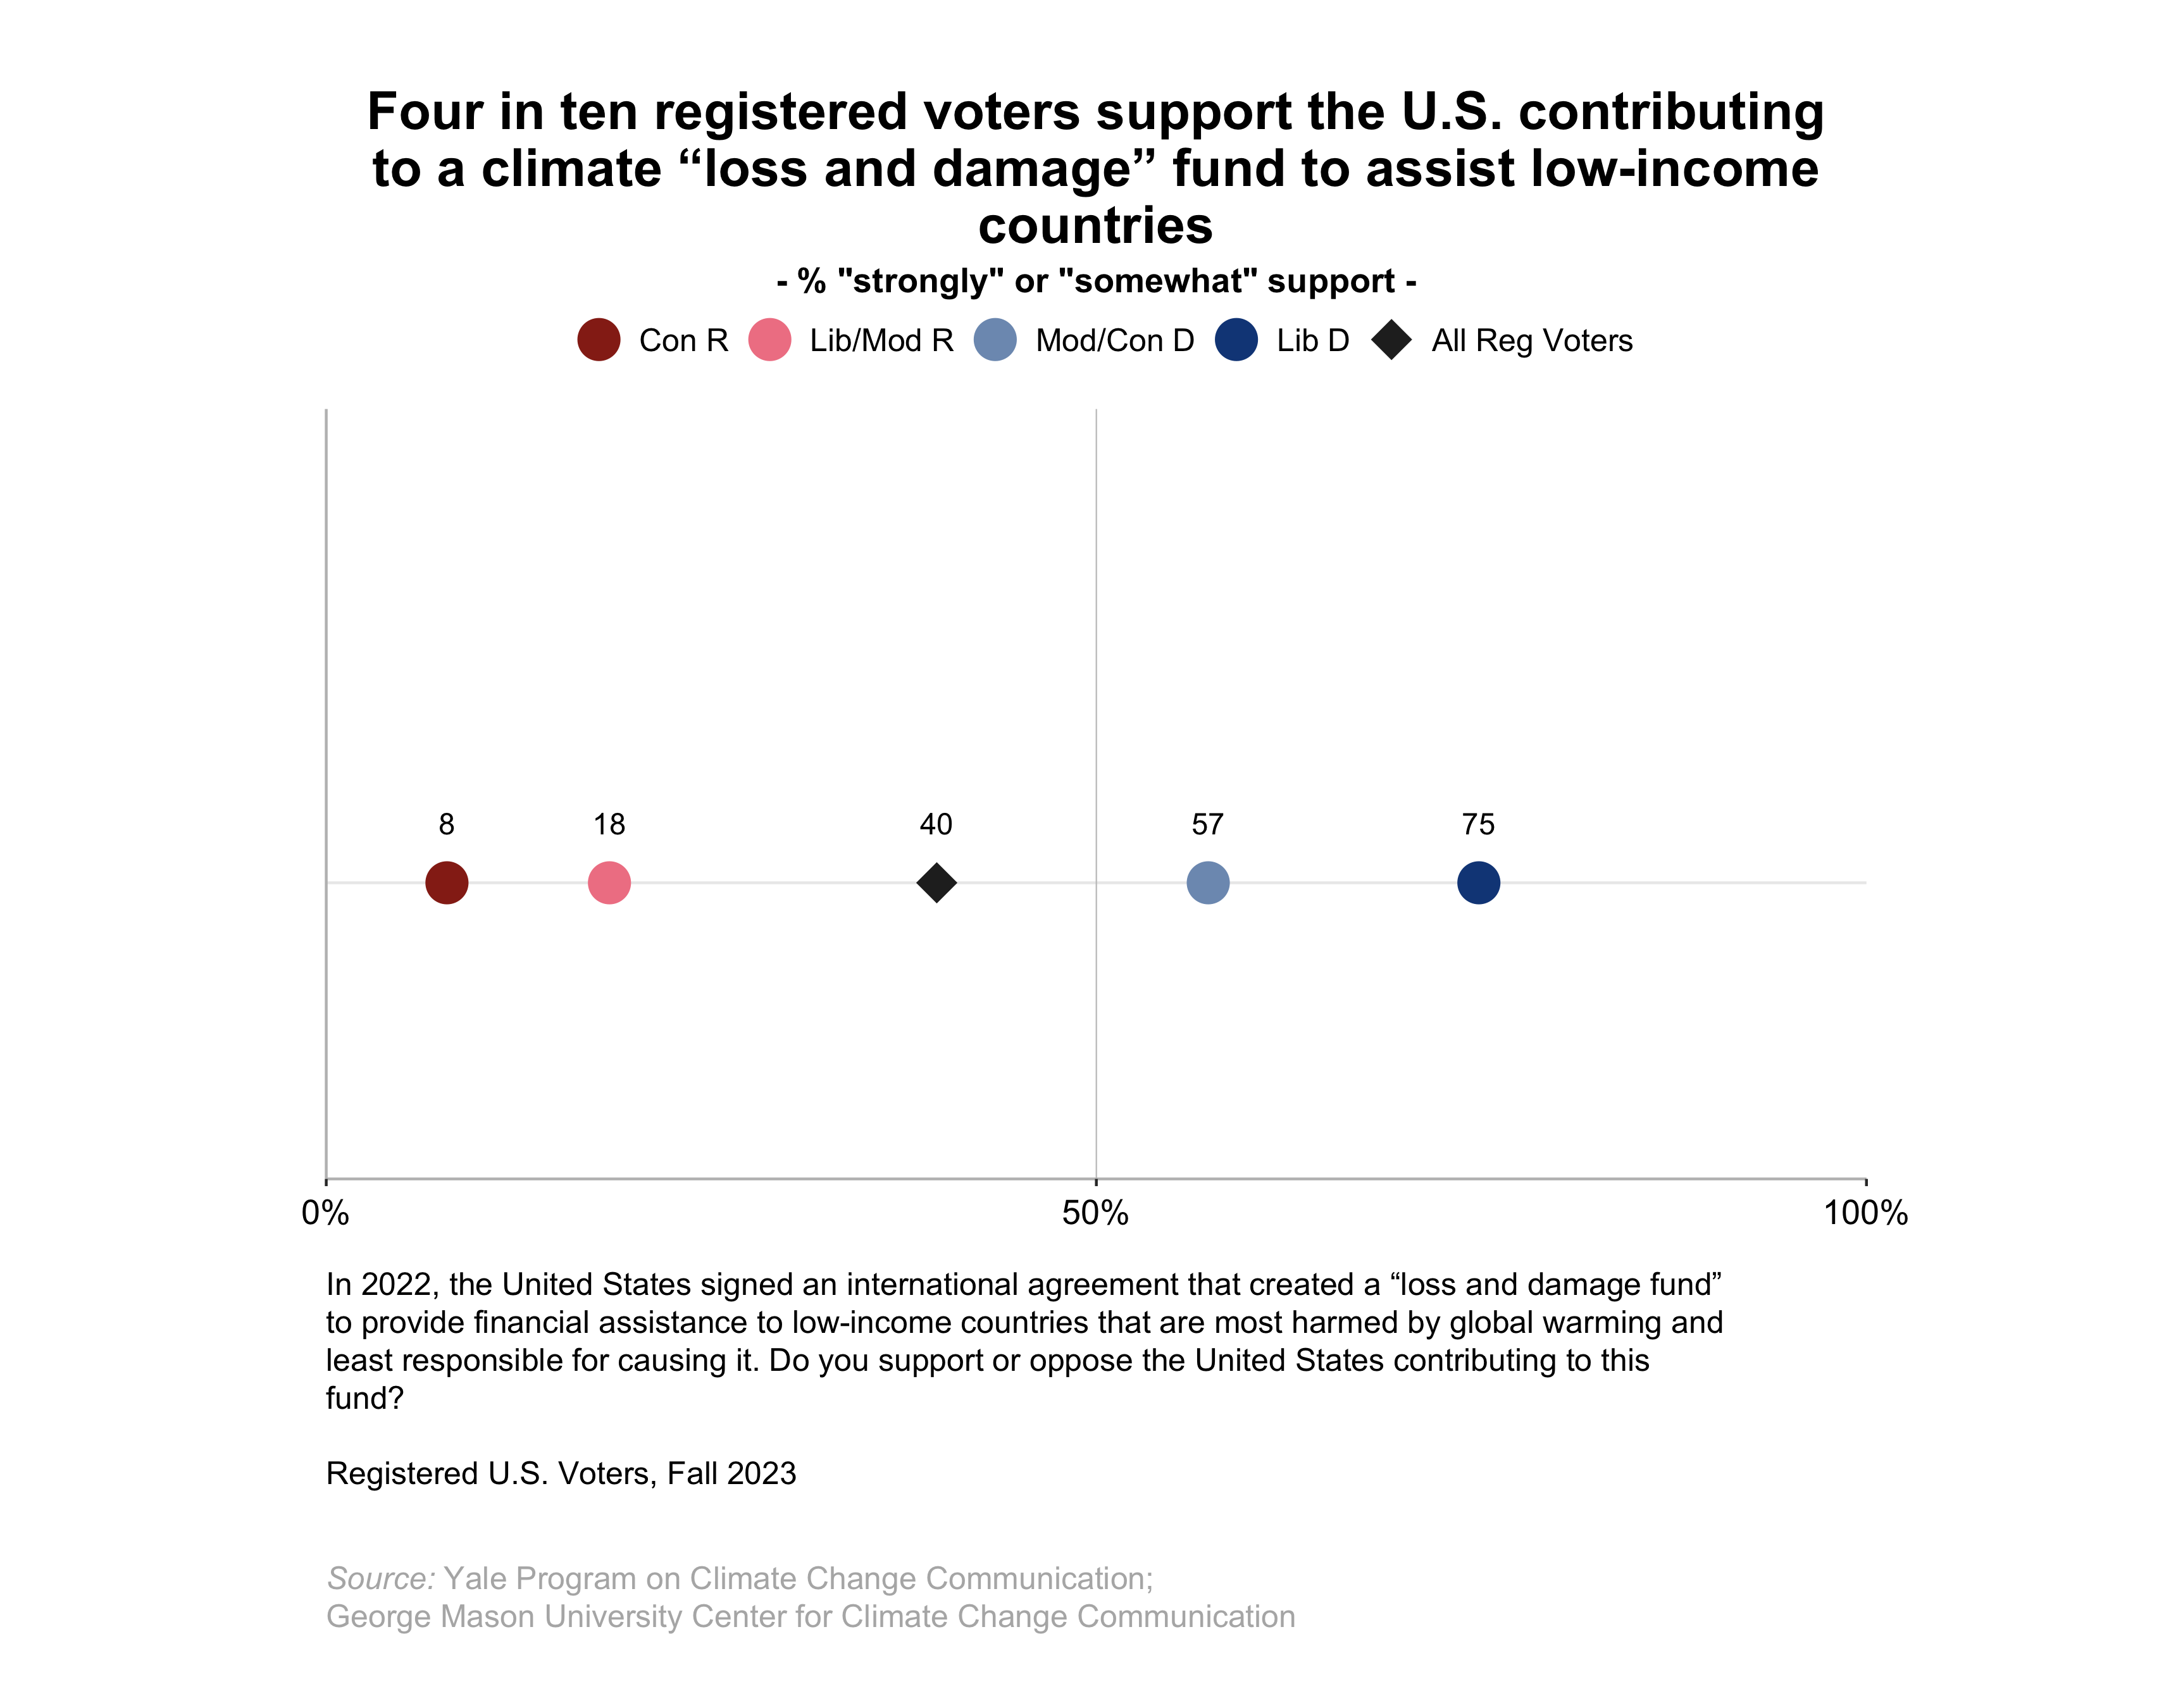
7.3. Four in ten registered voters support the U.S. contributing to a climate “loss and damage” fund to assist low-income countries.
In 2015, officials from 197 countries (nearly every country in the world) met in Paris at the United Nations Climate Change Conference and negotiated a global agreement to limit global warming. In 2022, as part of subsequent international negotiations, the United States signed an agreement that created a “loss and damage fund” to provide financial assistance to low-income countries that are most harmed by global warming and least responsible for causing it.
Four in ten registered voters (40%) support the U.S. contributing to this fund. This includes majorities of liberal Democrats (75%) and moderate/conservative Democrats (57%), but fewer liberal/moderate Republicans (18%) and conservative Republicans (8%). An additional 26% of registered voters neither support nor oppose the U.S. contributing to this fund (refer to data tables, p. 57).
8. Special Section: Perceptions of Fossil Fuel Companies
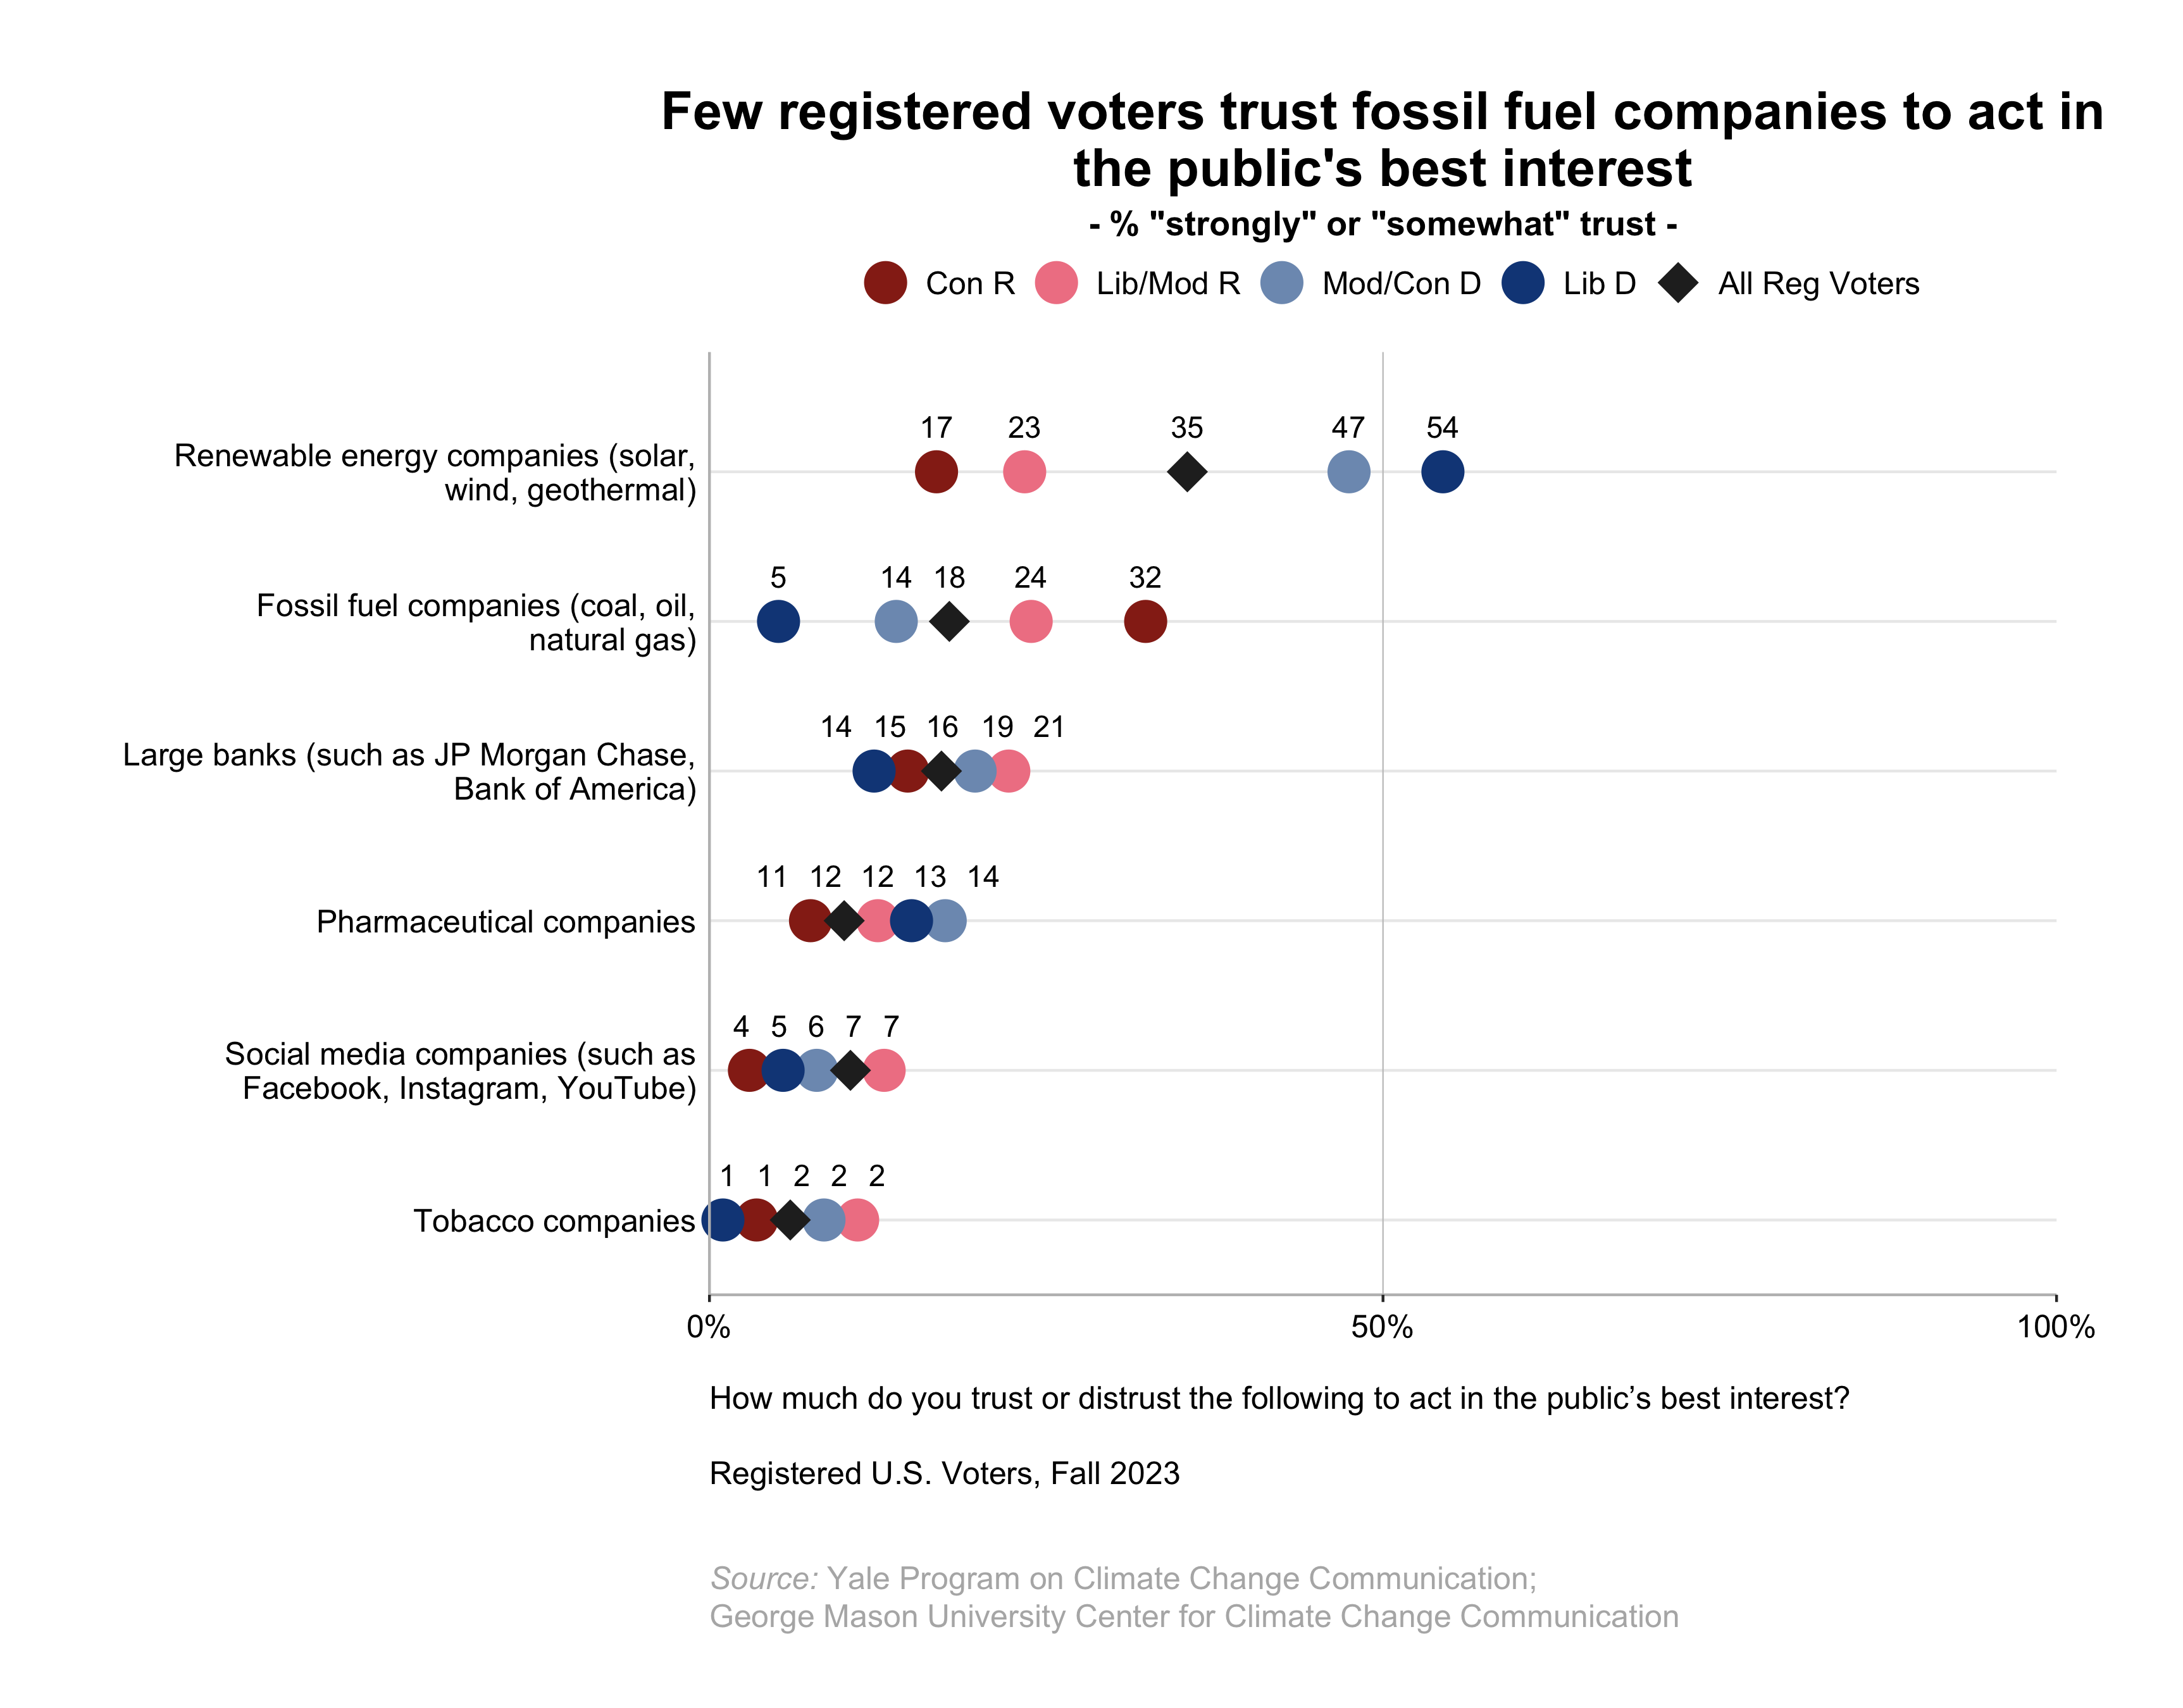
8.1. Few registered voters trust fossil fuel companies to act in the public’s best interest.
About one in three registered voters (35%) say they trust renewable energy companies to act in the public’s best interest. By contrast, only 18% of registered voters trust fossil fuel companies to act in the public’s best interest. Trust in renewable energy companies is highest among liberal Democrats (54%) and moderate/conservative Democrats (47%), while trust in fossil fuel companies is highest among conservative Republicans (32%; the highest level of trust among this group of all of the types of companies asked about) and moderate/liberal Republicans (24%).
Although trust in fossil fuel companies to act in the public’s best interest is low, trust is even lower for large banks (16%), pharmaceutical companies (12%), social media companies (7%), and tobacco companies (2%).
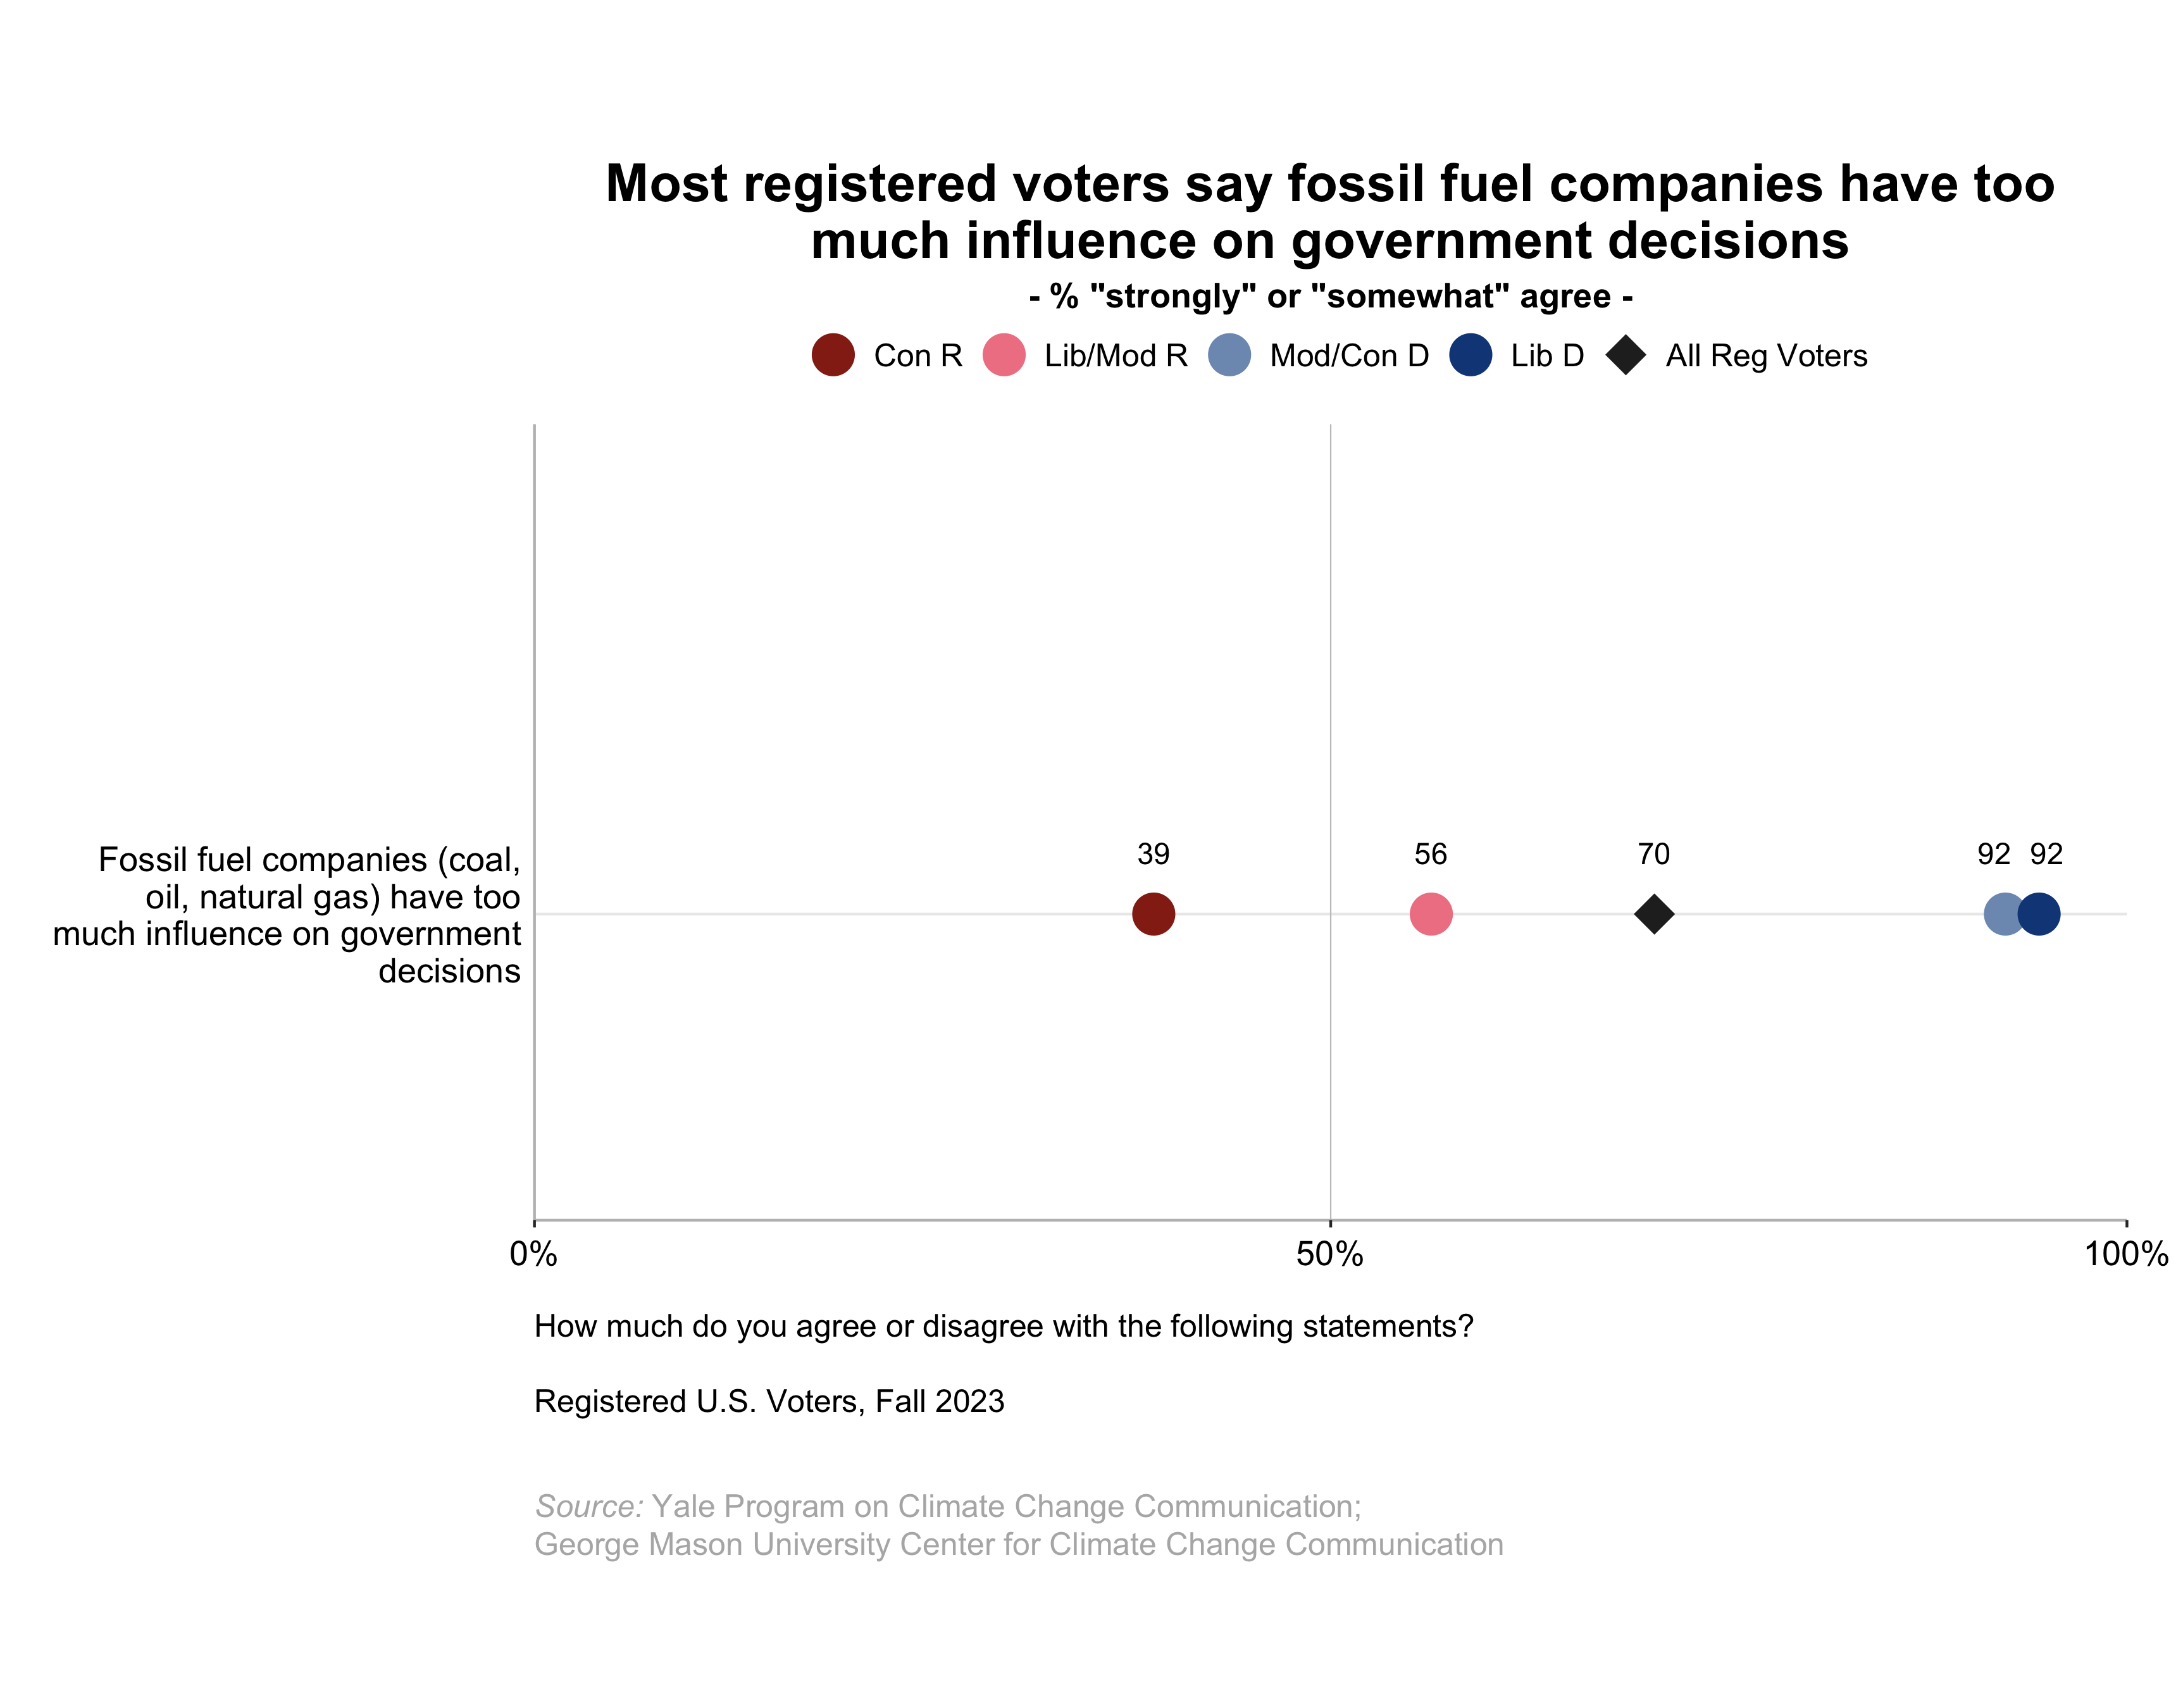
8.2. Most registered voters say fossil fuel companies have too much influence on government decisions.
Seven in ten registered voters (70%) agree that fossil fuel companies have too much influence on government decisions. Large majorities of liberal Democrats and moderate/conservative Democrats (both 92%), a majority of liberal/moderate Republicans (56%), and about four in ten conservative Republicans (39%) agree.
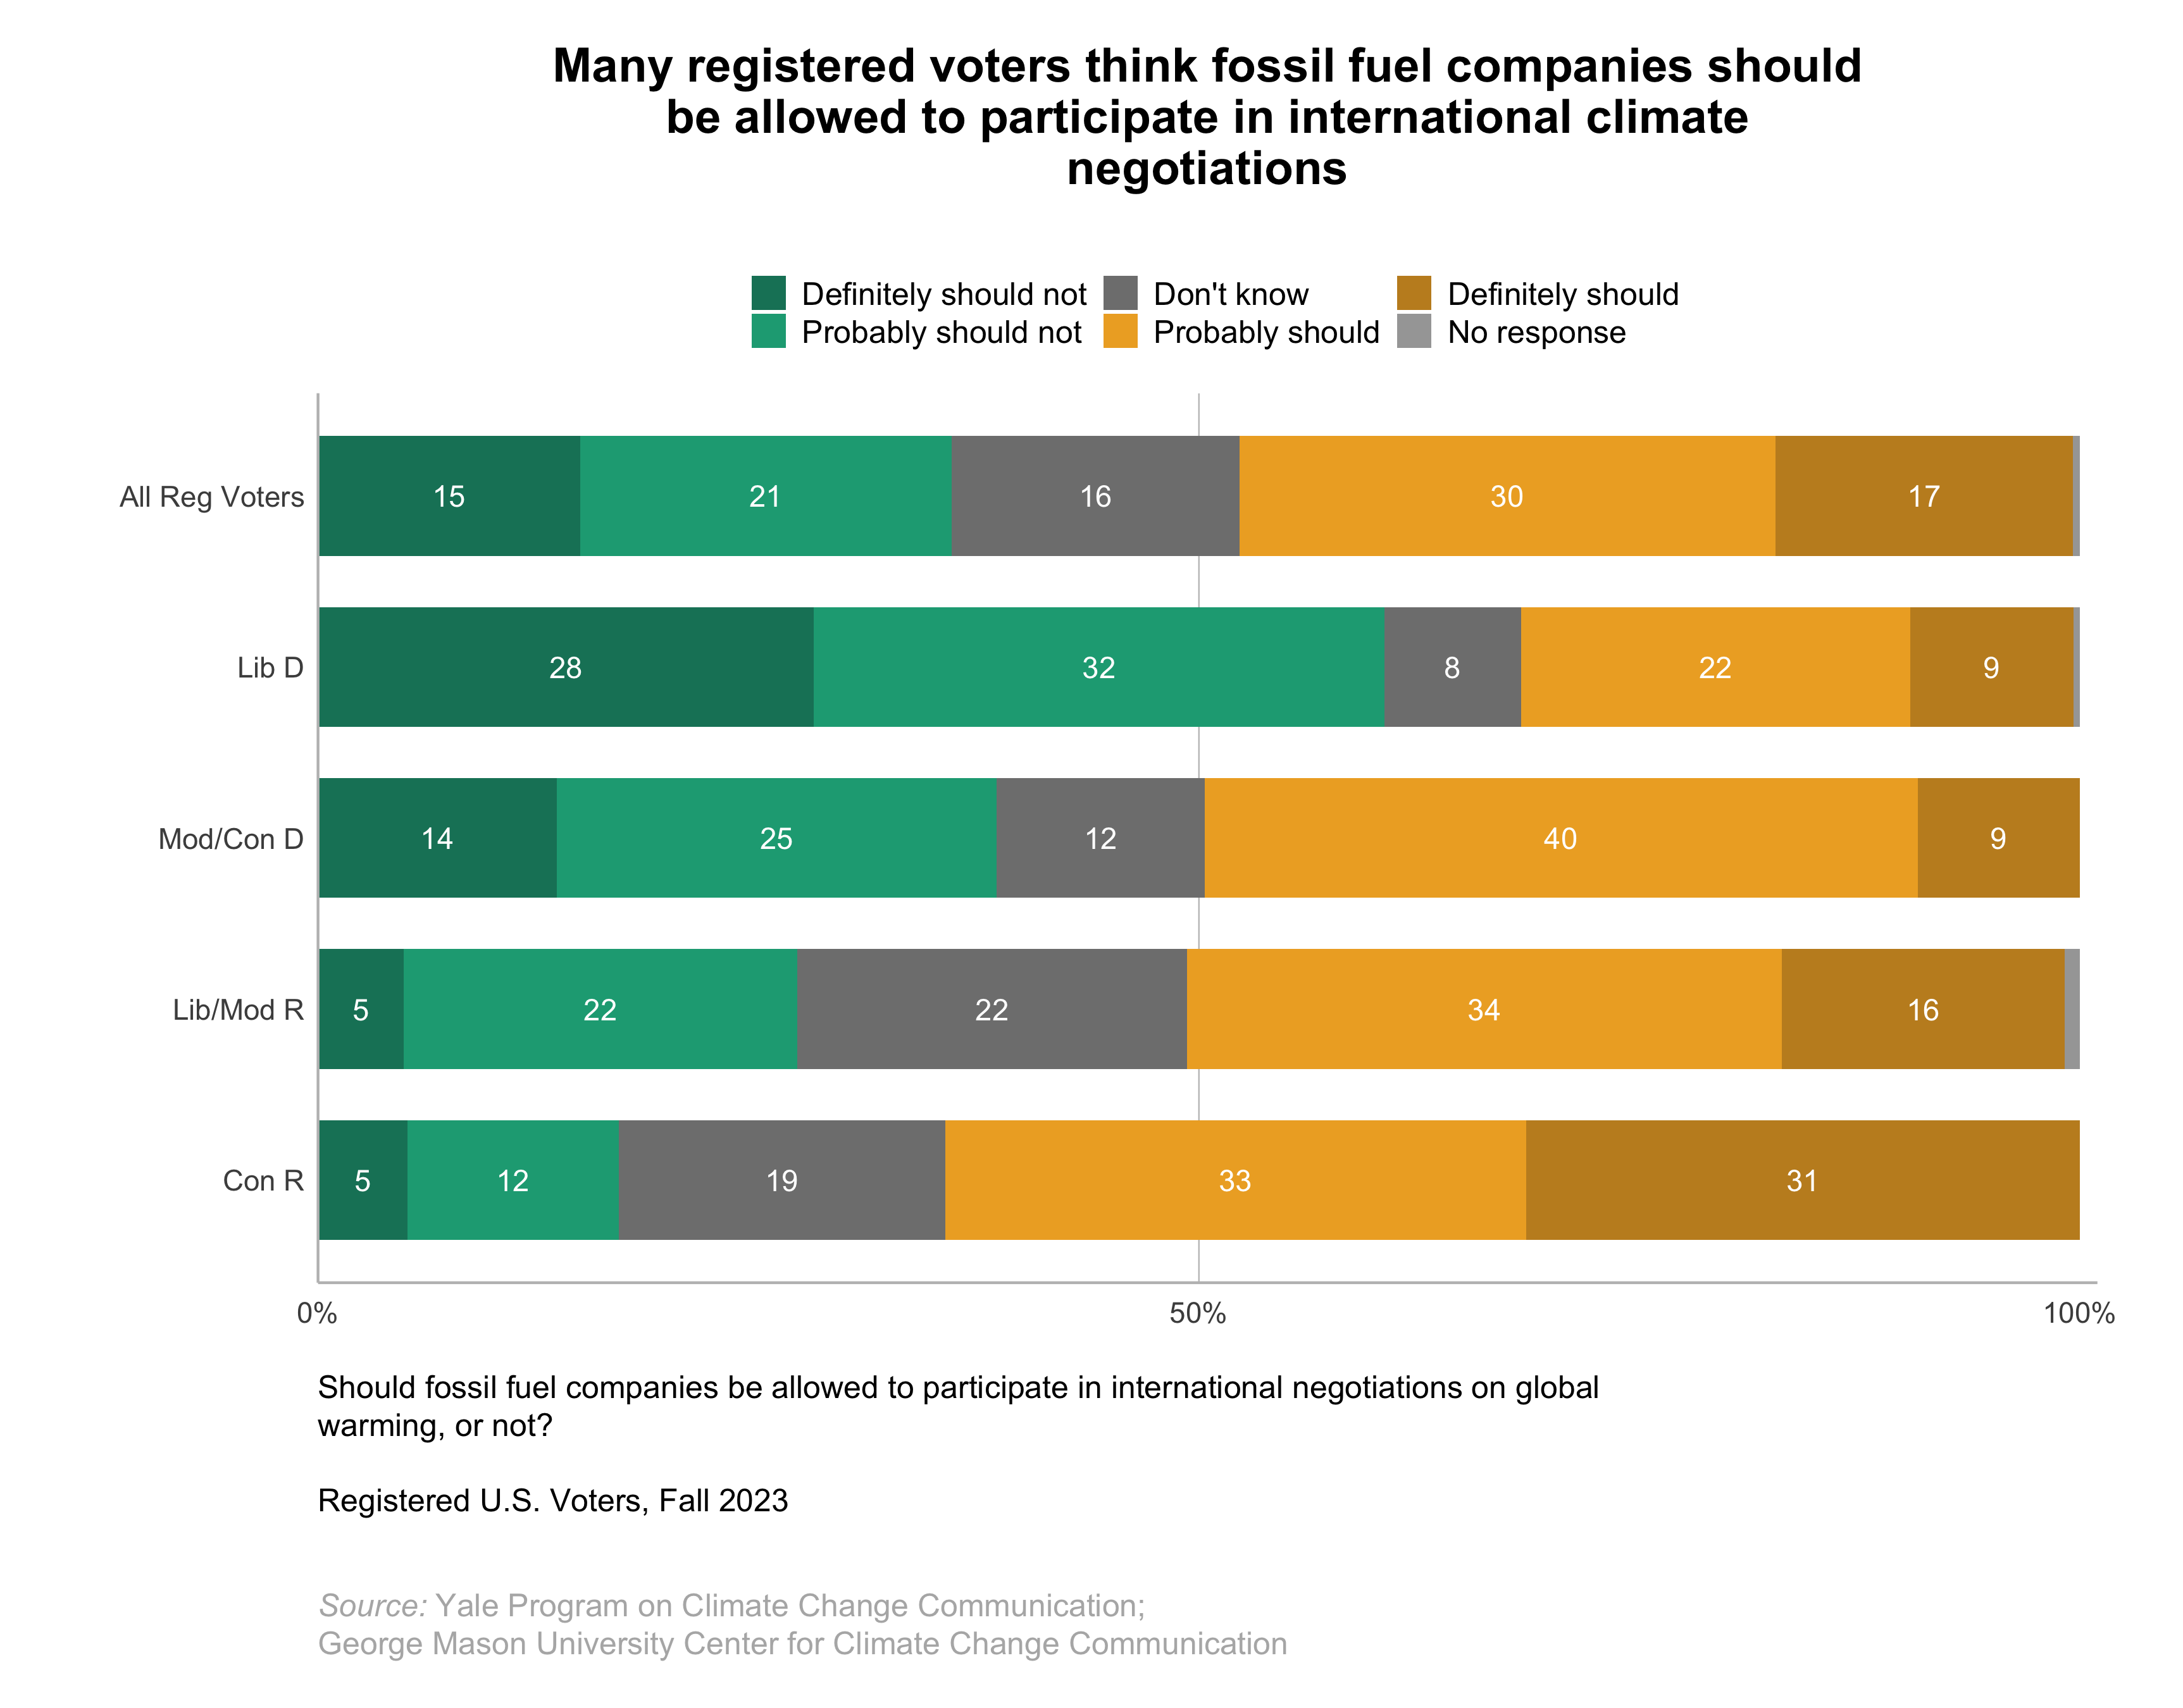
8.3. Many registered voters think fossil fuel companies should be allowed to participate in international climate negotiations.
Forty-seven percent of registered voters think fossil fuel companies either “definitely should” (17%) or “probably should” (30%) be allowed to participate in international climate negotiations, while 36% think they either “definitely should not” (15%) or “probably should not” (21%) be allowed to participate.
About six in ten conservative Republicans (64%) and half of liberal/moderate Republicans and moderate/conservative Democrats (both 50%) think fossil fuel companies should be allowed to participate in international climate negotiations. By contrast, 61% of liberal Democrats think they should not be allowed to participate, while 31% think they should.
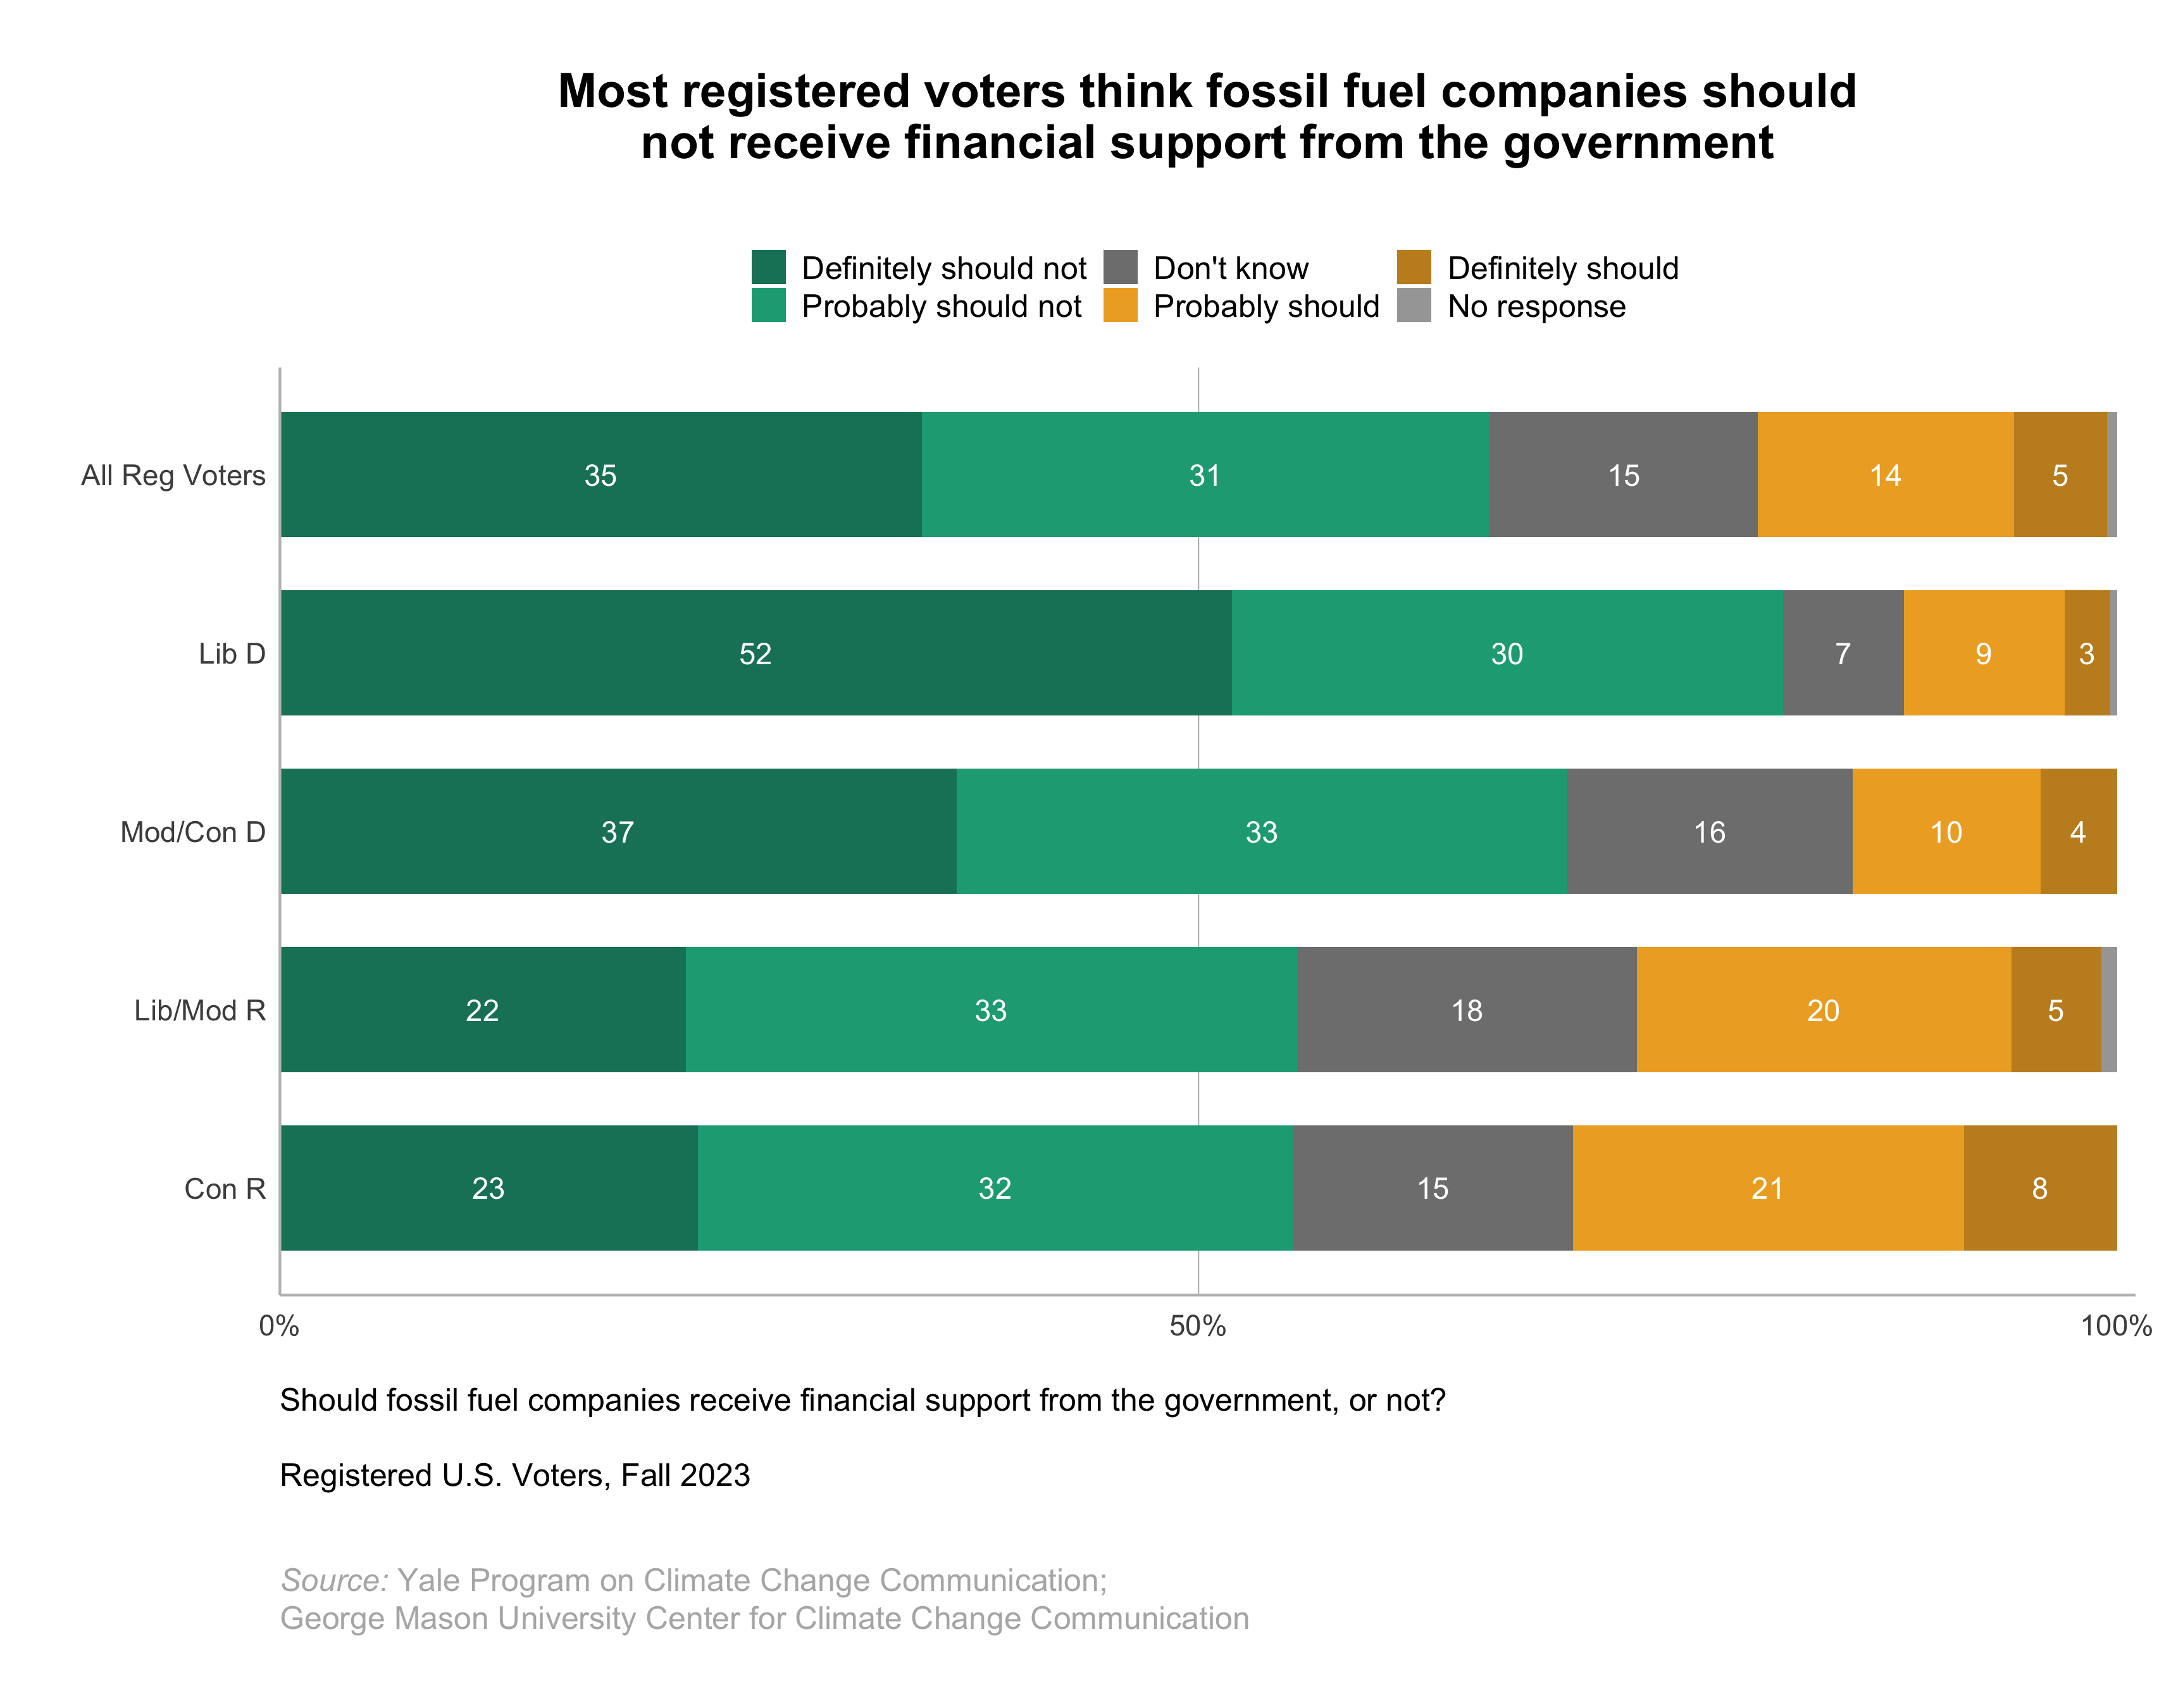
8.4. Most registered voters think fossil fuel companies should not receive financial support from the government.
About two in three registered voters (66%) think fossil fuel companies either “definitely should not” (35%) or “probably should not” (31%) receive financial support from the government, while only 19% think they either “definitely should” (5%) or “probably should” (14%) receive support.
Majorities of each political identity group, including 82% of liberal Democrats, 70% of moderate/conservative Democrats, and 55% of both liberal/moderate Republicans and conservative Republicans think fossil fuel companies should not receive financial support from the government.
9. Political Actions to Limit Global Warming
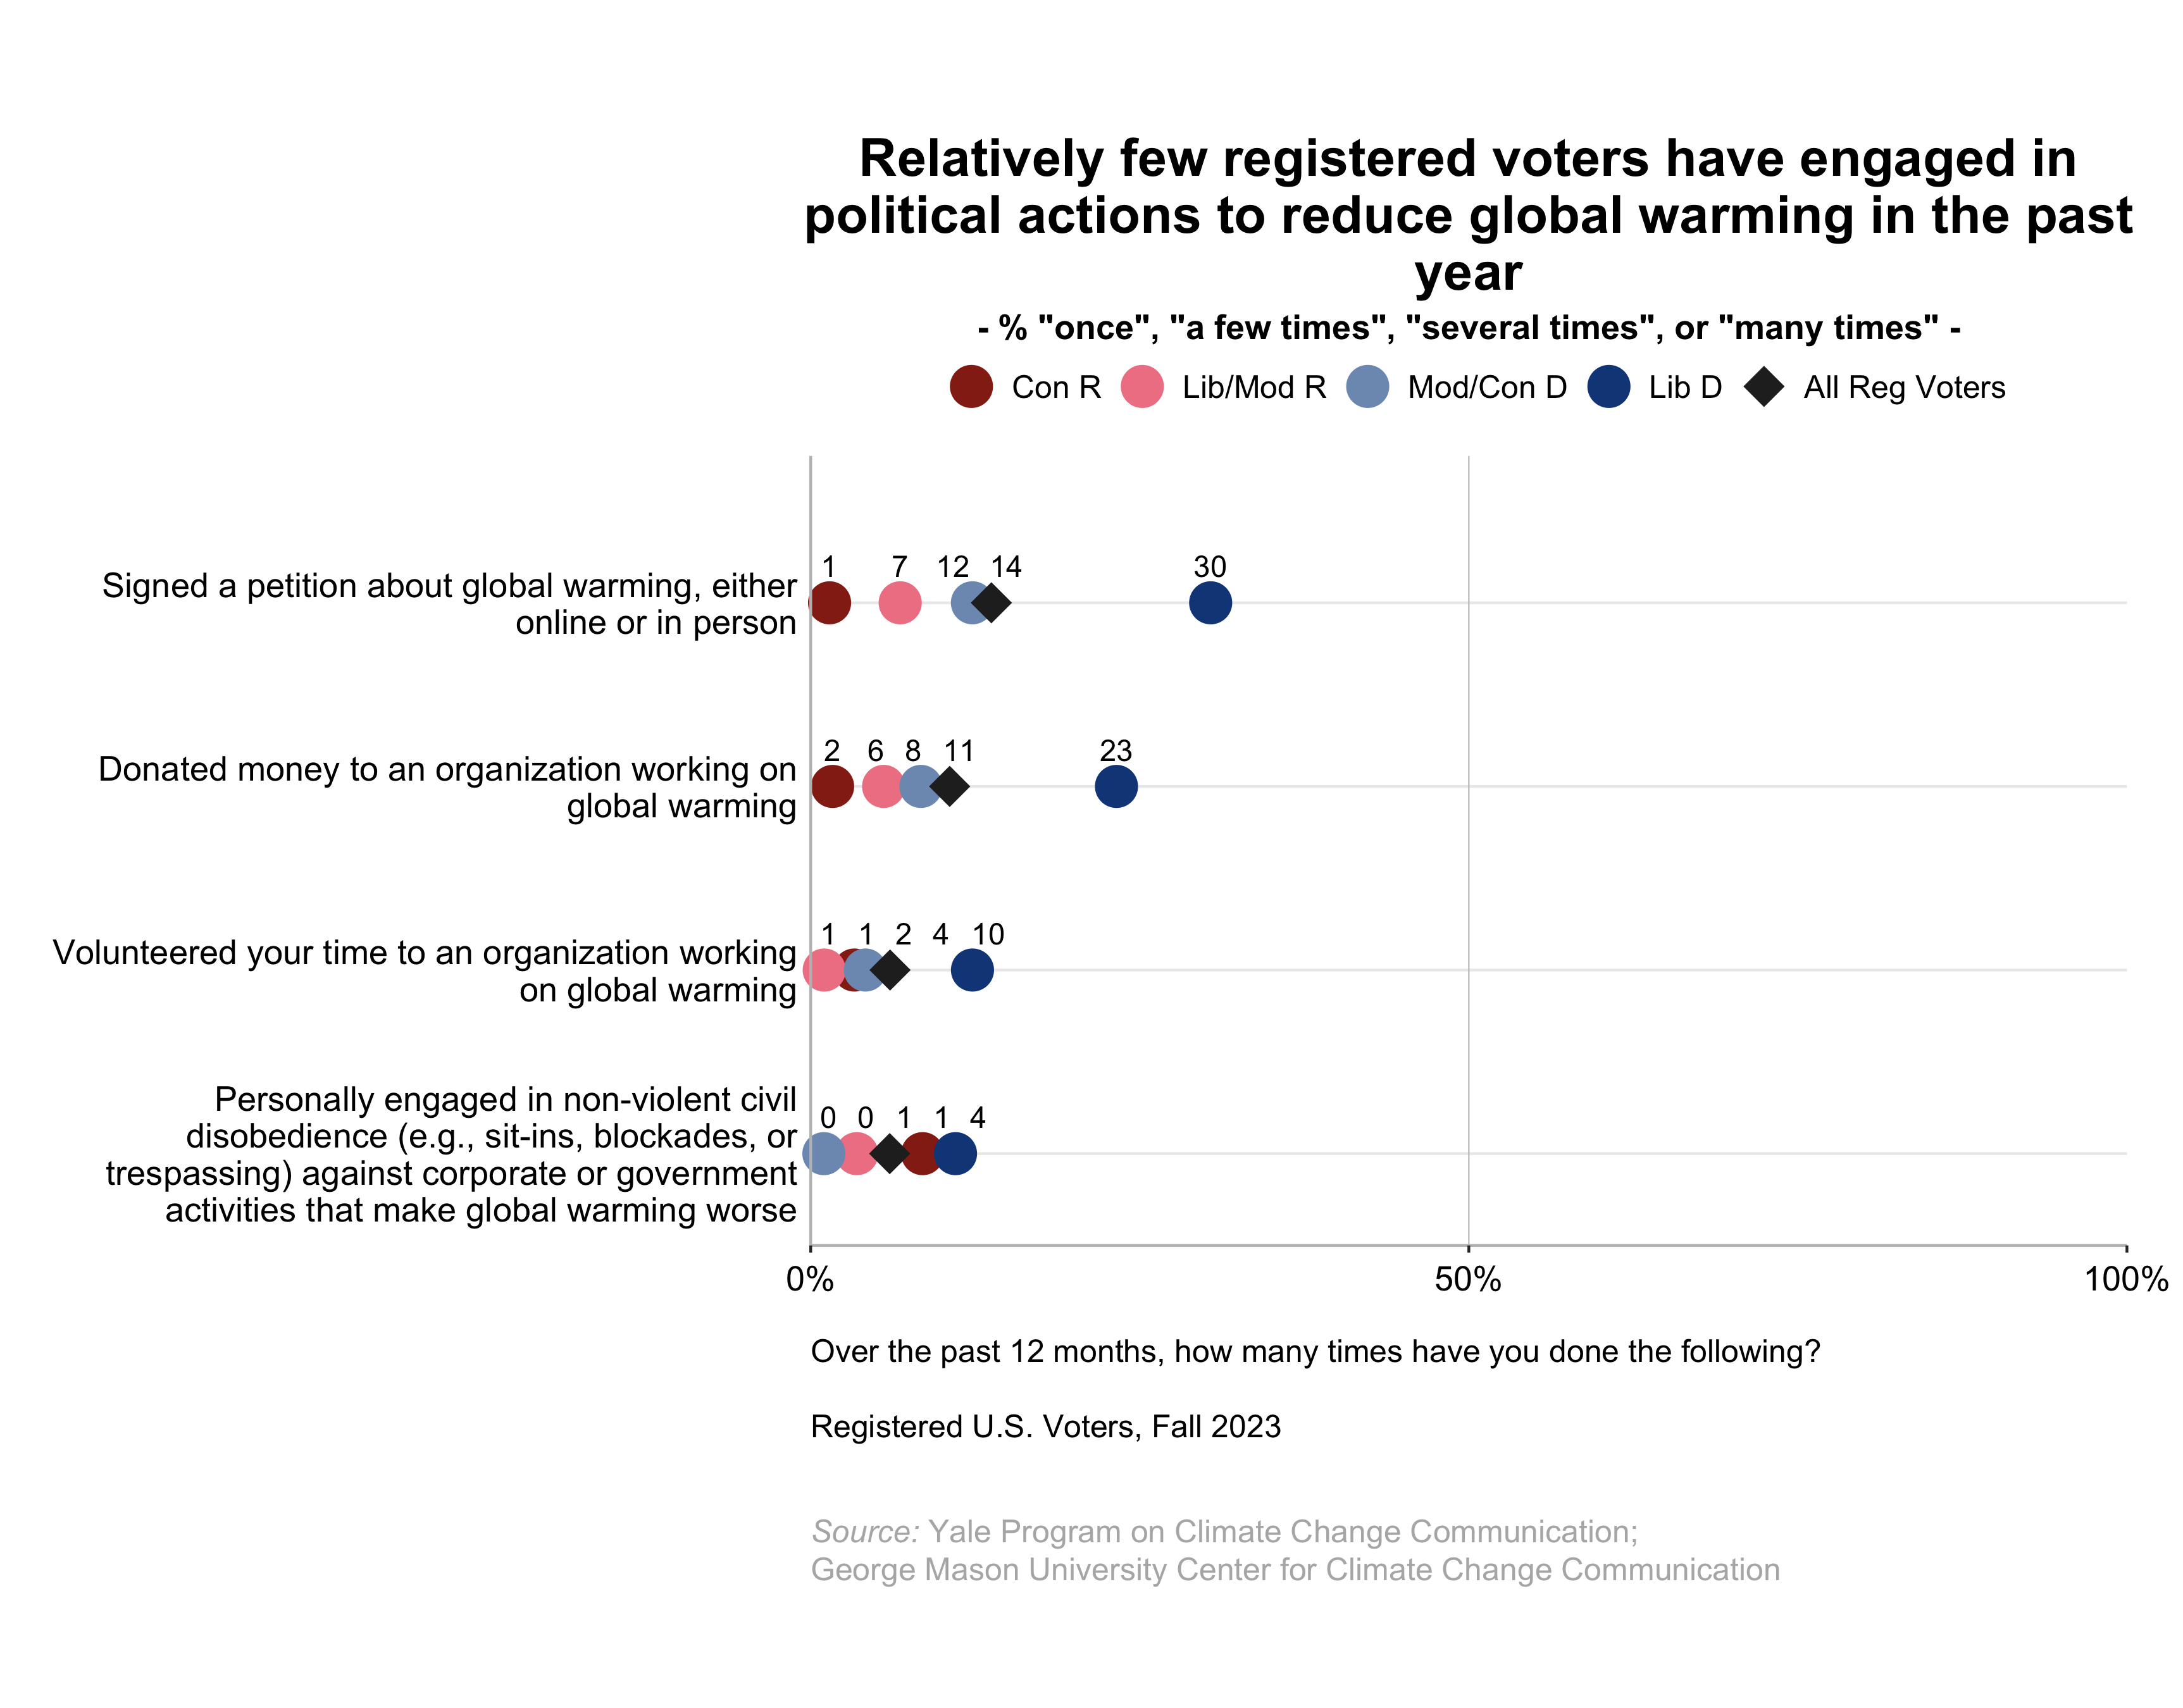
9.1. Relatively few registered voters have engaged in political actions to reduce global warming in the past year.
Relatively few registered voters have engaged in political actions to reduce global warming over the past 12 months, including 14% who say they have signed a petition about global warming at least “once,” 11% who say they have donated money to an organization working on global warming at least “once,” and 4% who say they have volunteered their time to an organization working on global warming. One percent of registered voters say they have personally engaged in non-violent civil disobedience against corporate or government activities that make global warming worse at least “once” over the past 12 months.
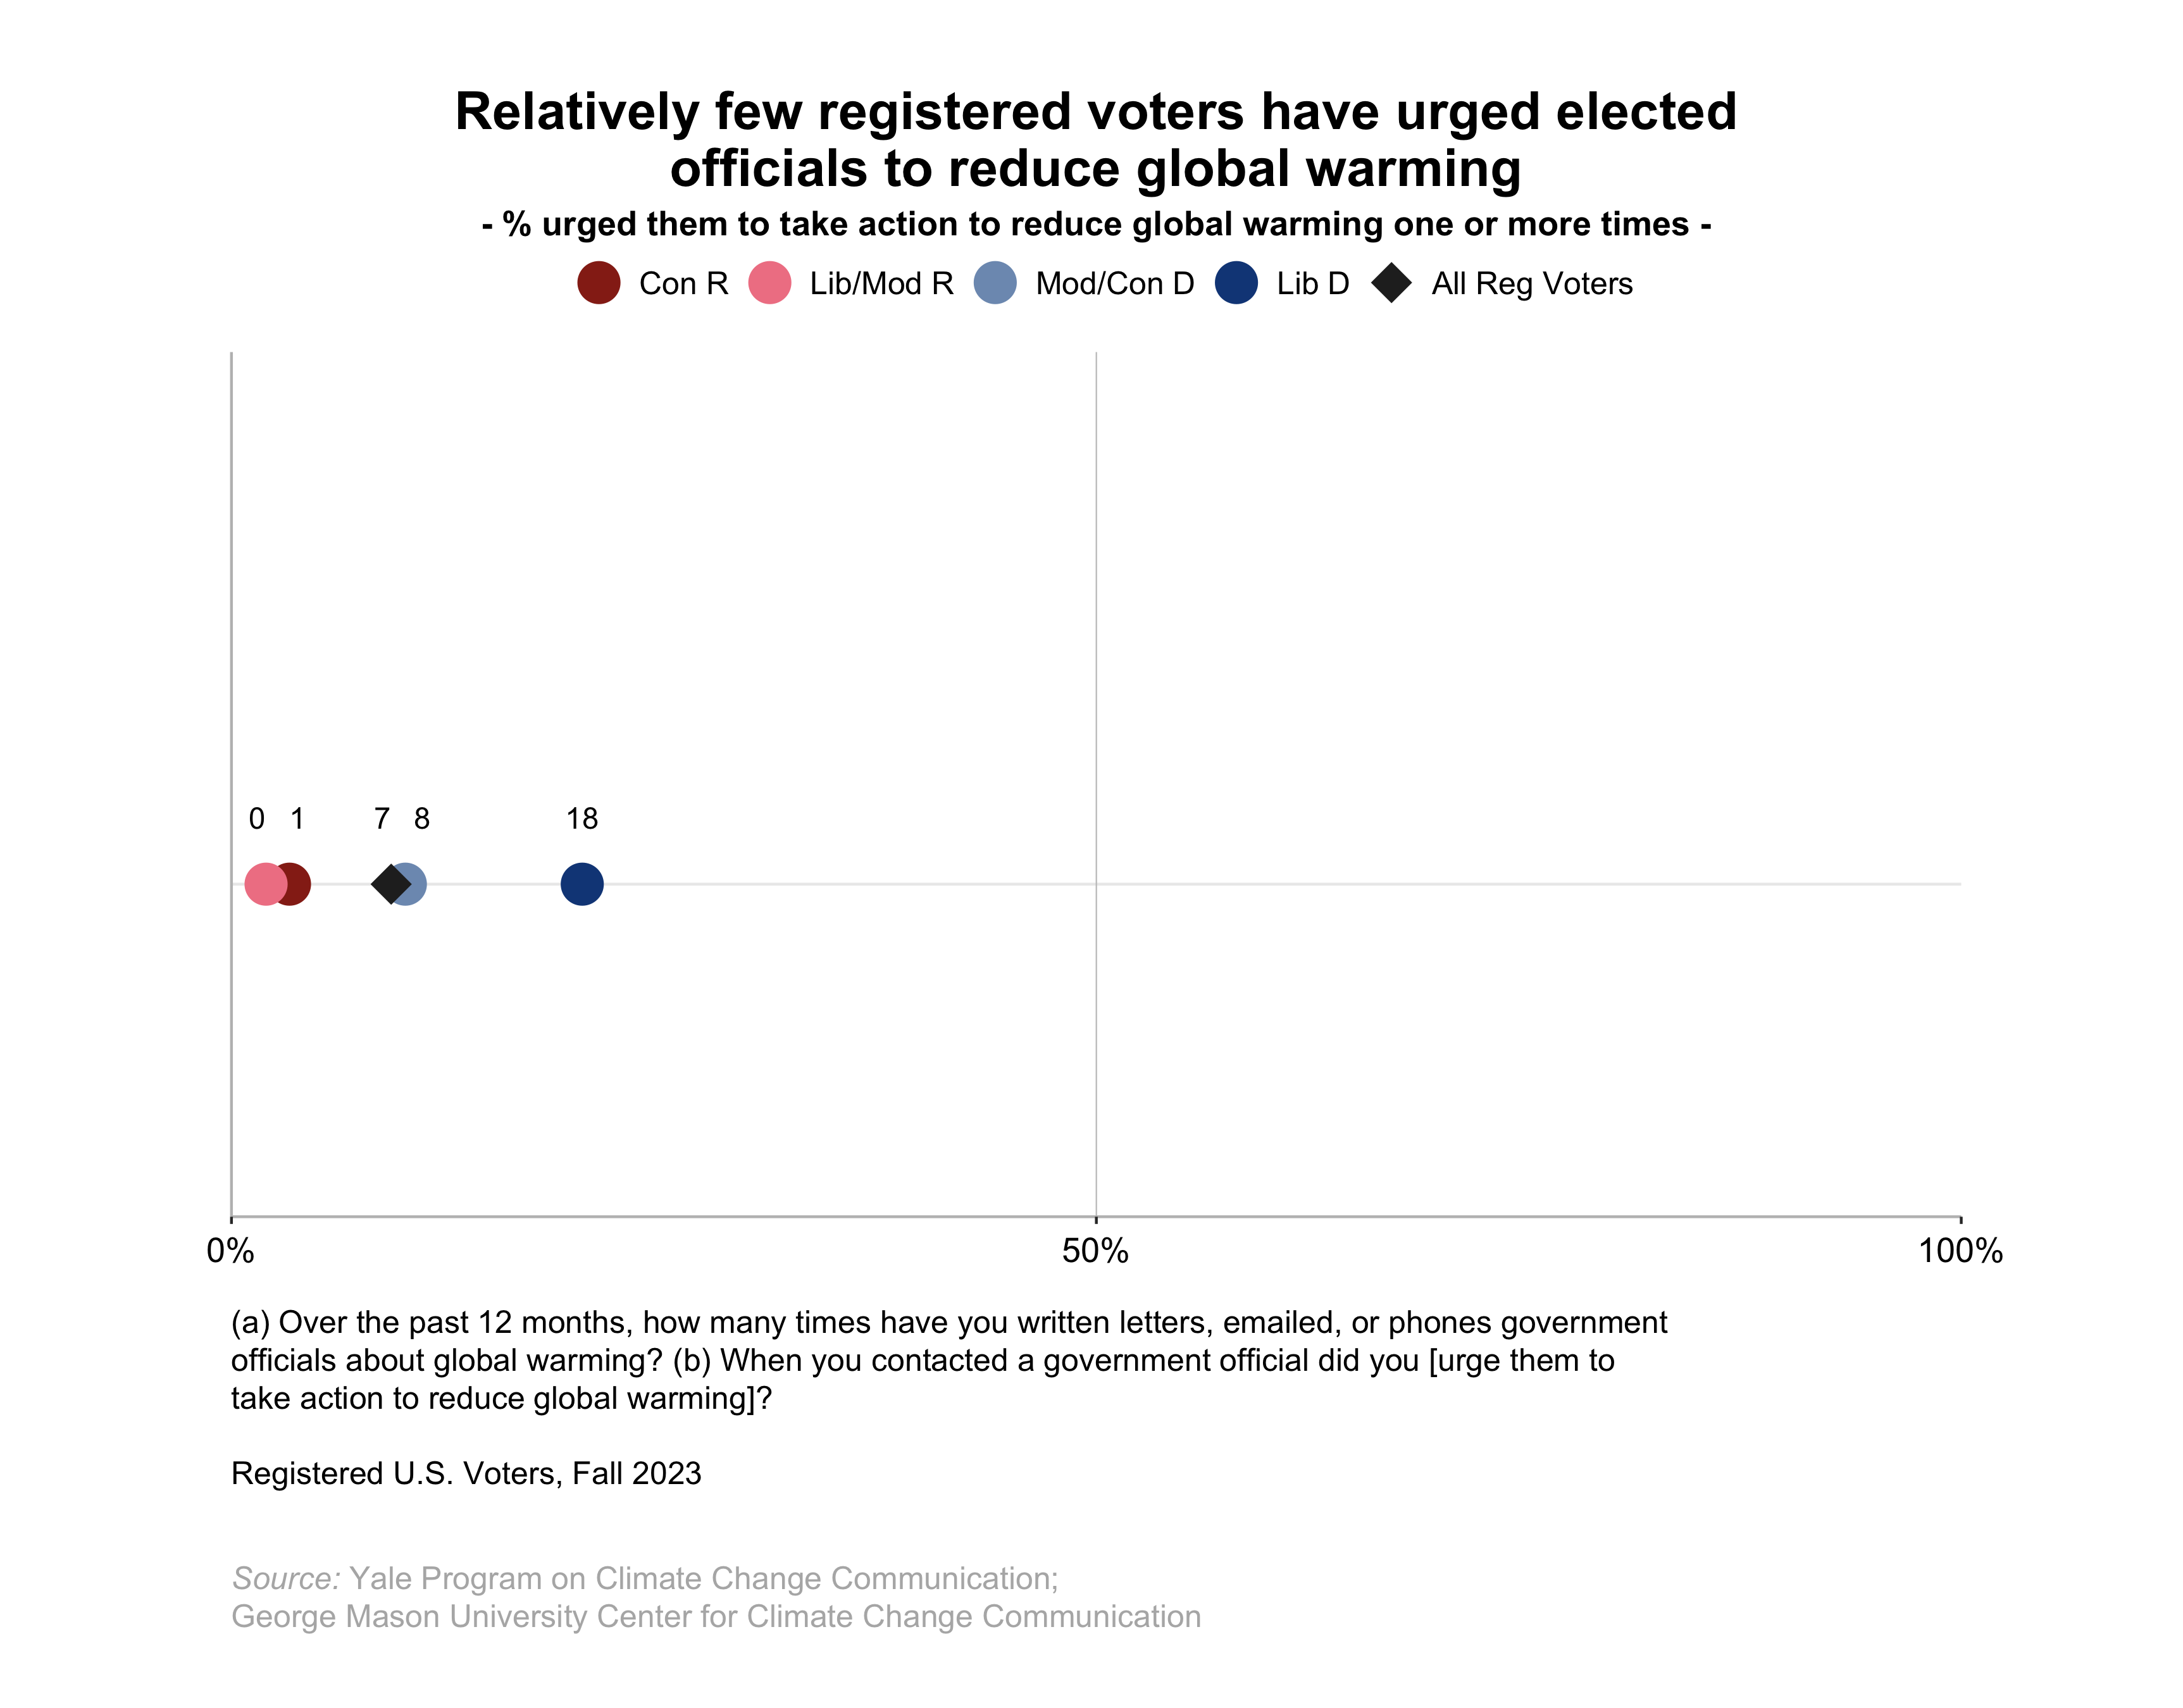
9.2. Relatively few registered voters have urged elected officials to reduce global warming.
Seven percent of registered voters have contacted government officials to urge them to take action to reduce global warming at least once over the past 12 months. This includes 18% of liberal Democrats and 8% of moderate/conservative Democrats, but only 1% of conservative Republicans and no liberal/moderate Republicans.
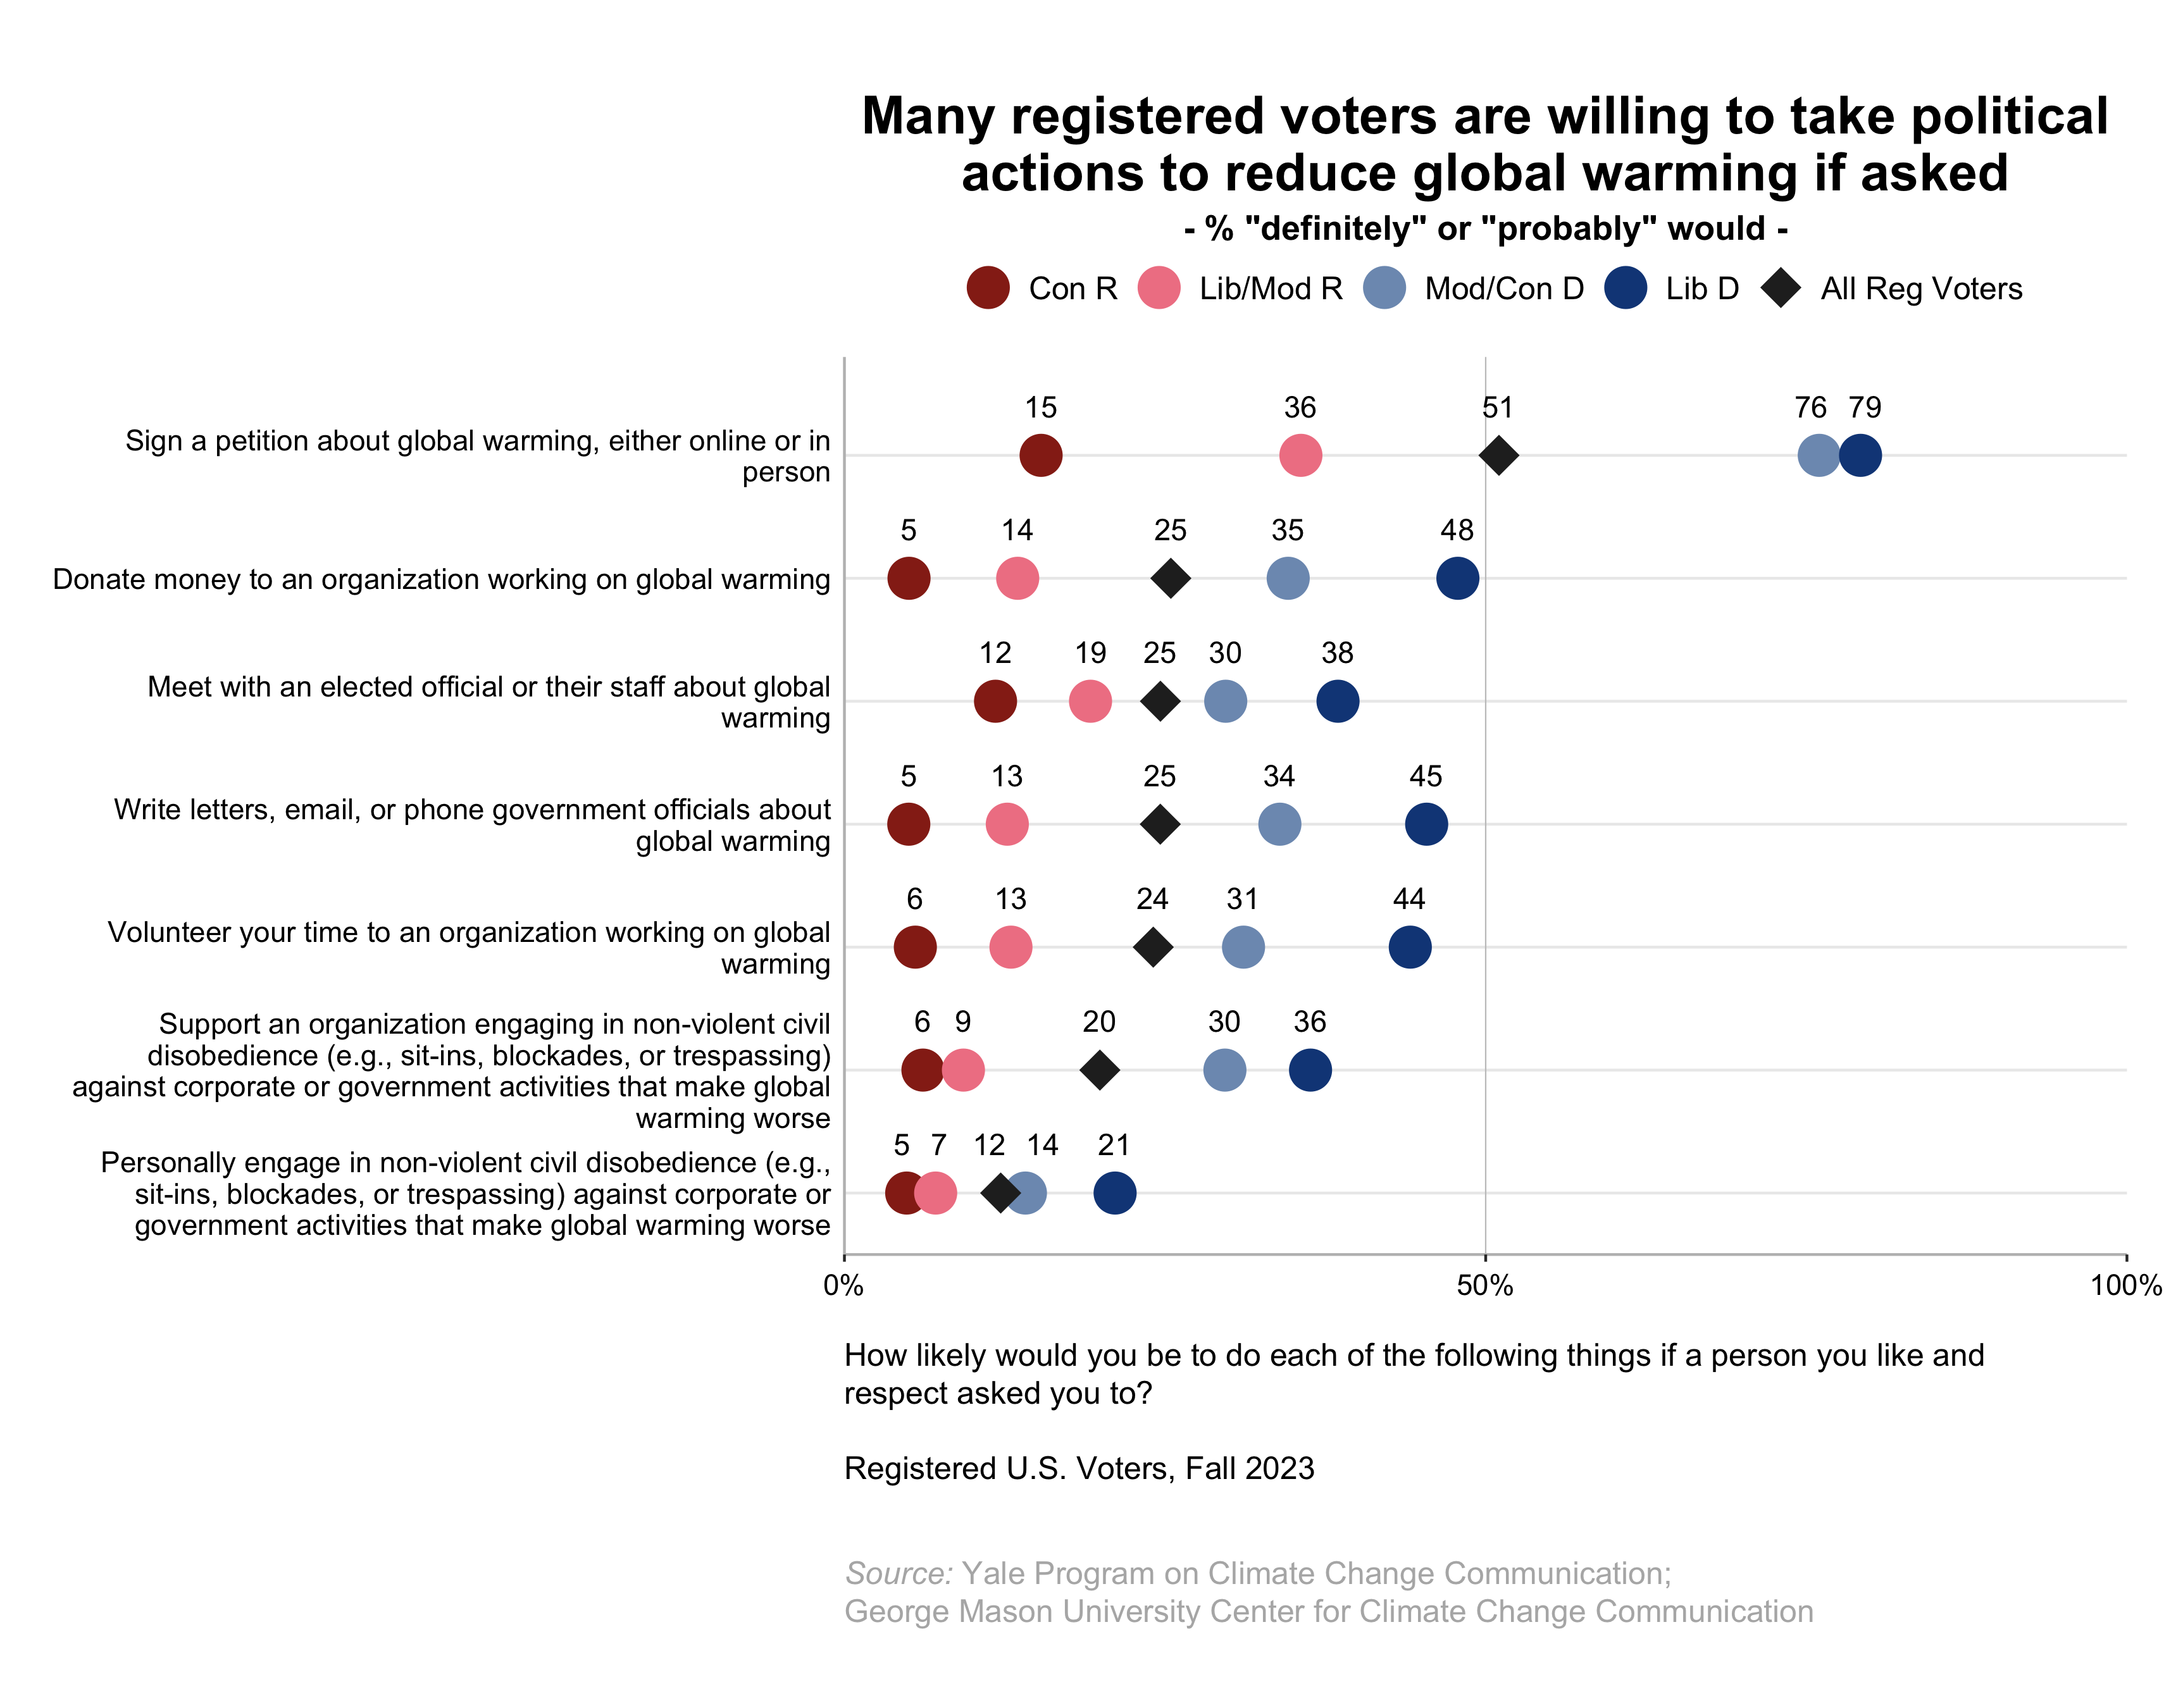
9.3. Many registered voters are willing to take political actions to reduce global warming if asked.
About half of registered voters (51%) say they would sign a petition about global warming if someone they like and respect asked them to, including large majorities of liberal Democrats (79%) and moderate/conservative Democrats (76%), but fewer liberal/moderate Republicans (36%) and conservative Republicans (15%). Fewer say they would donate money to an organization working on global warming (25%), meet with an elected official or their staff about global warming (25%), contact government officials about global warming (25%), or volunteer their time to an organization working on global warming (24%).
One in five registered voters (20%) would support an organization engaging in non-violent civil disobedience against corporate or government activities that make global warming worse, and 12% (including 21% of liberal Democrats) would personally engage in such non-violent civil disobedience.
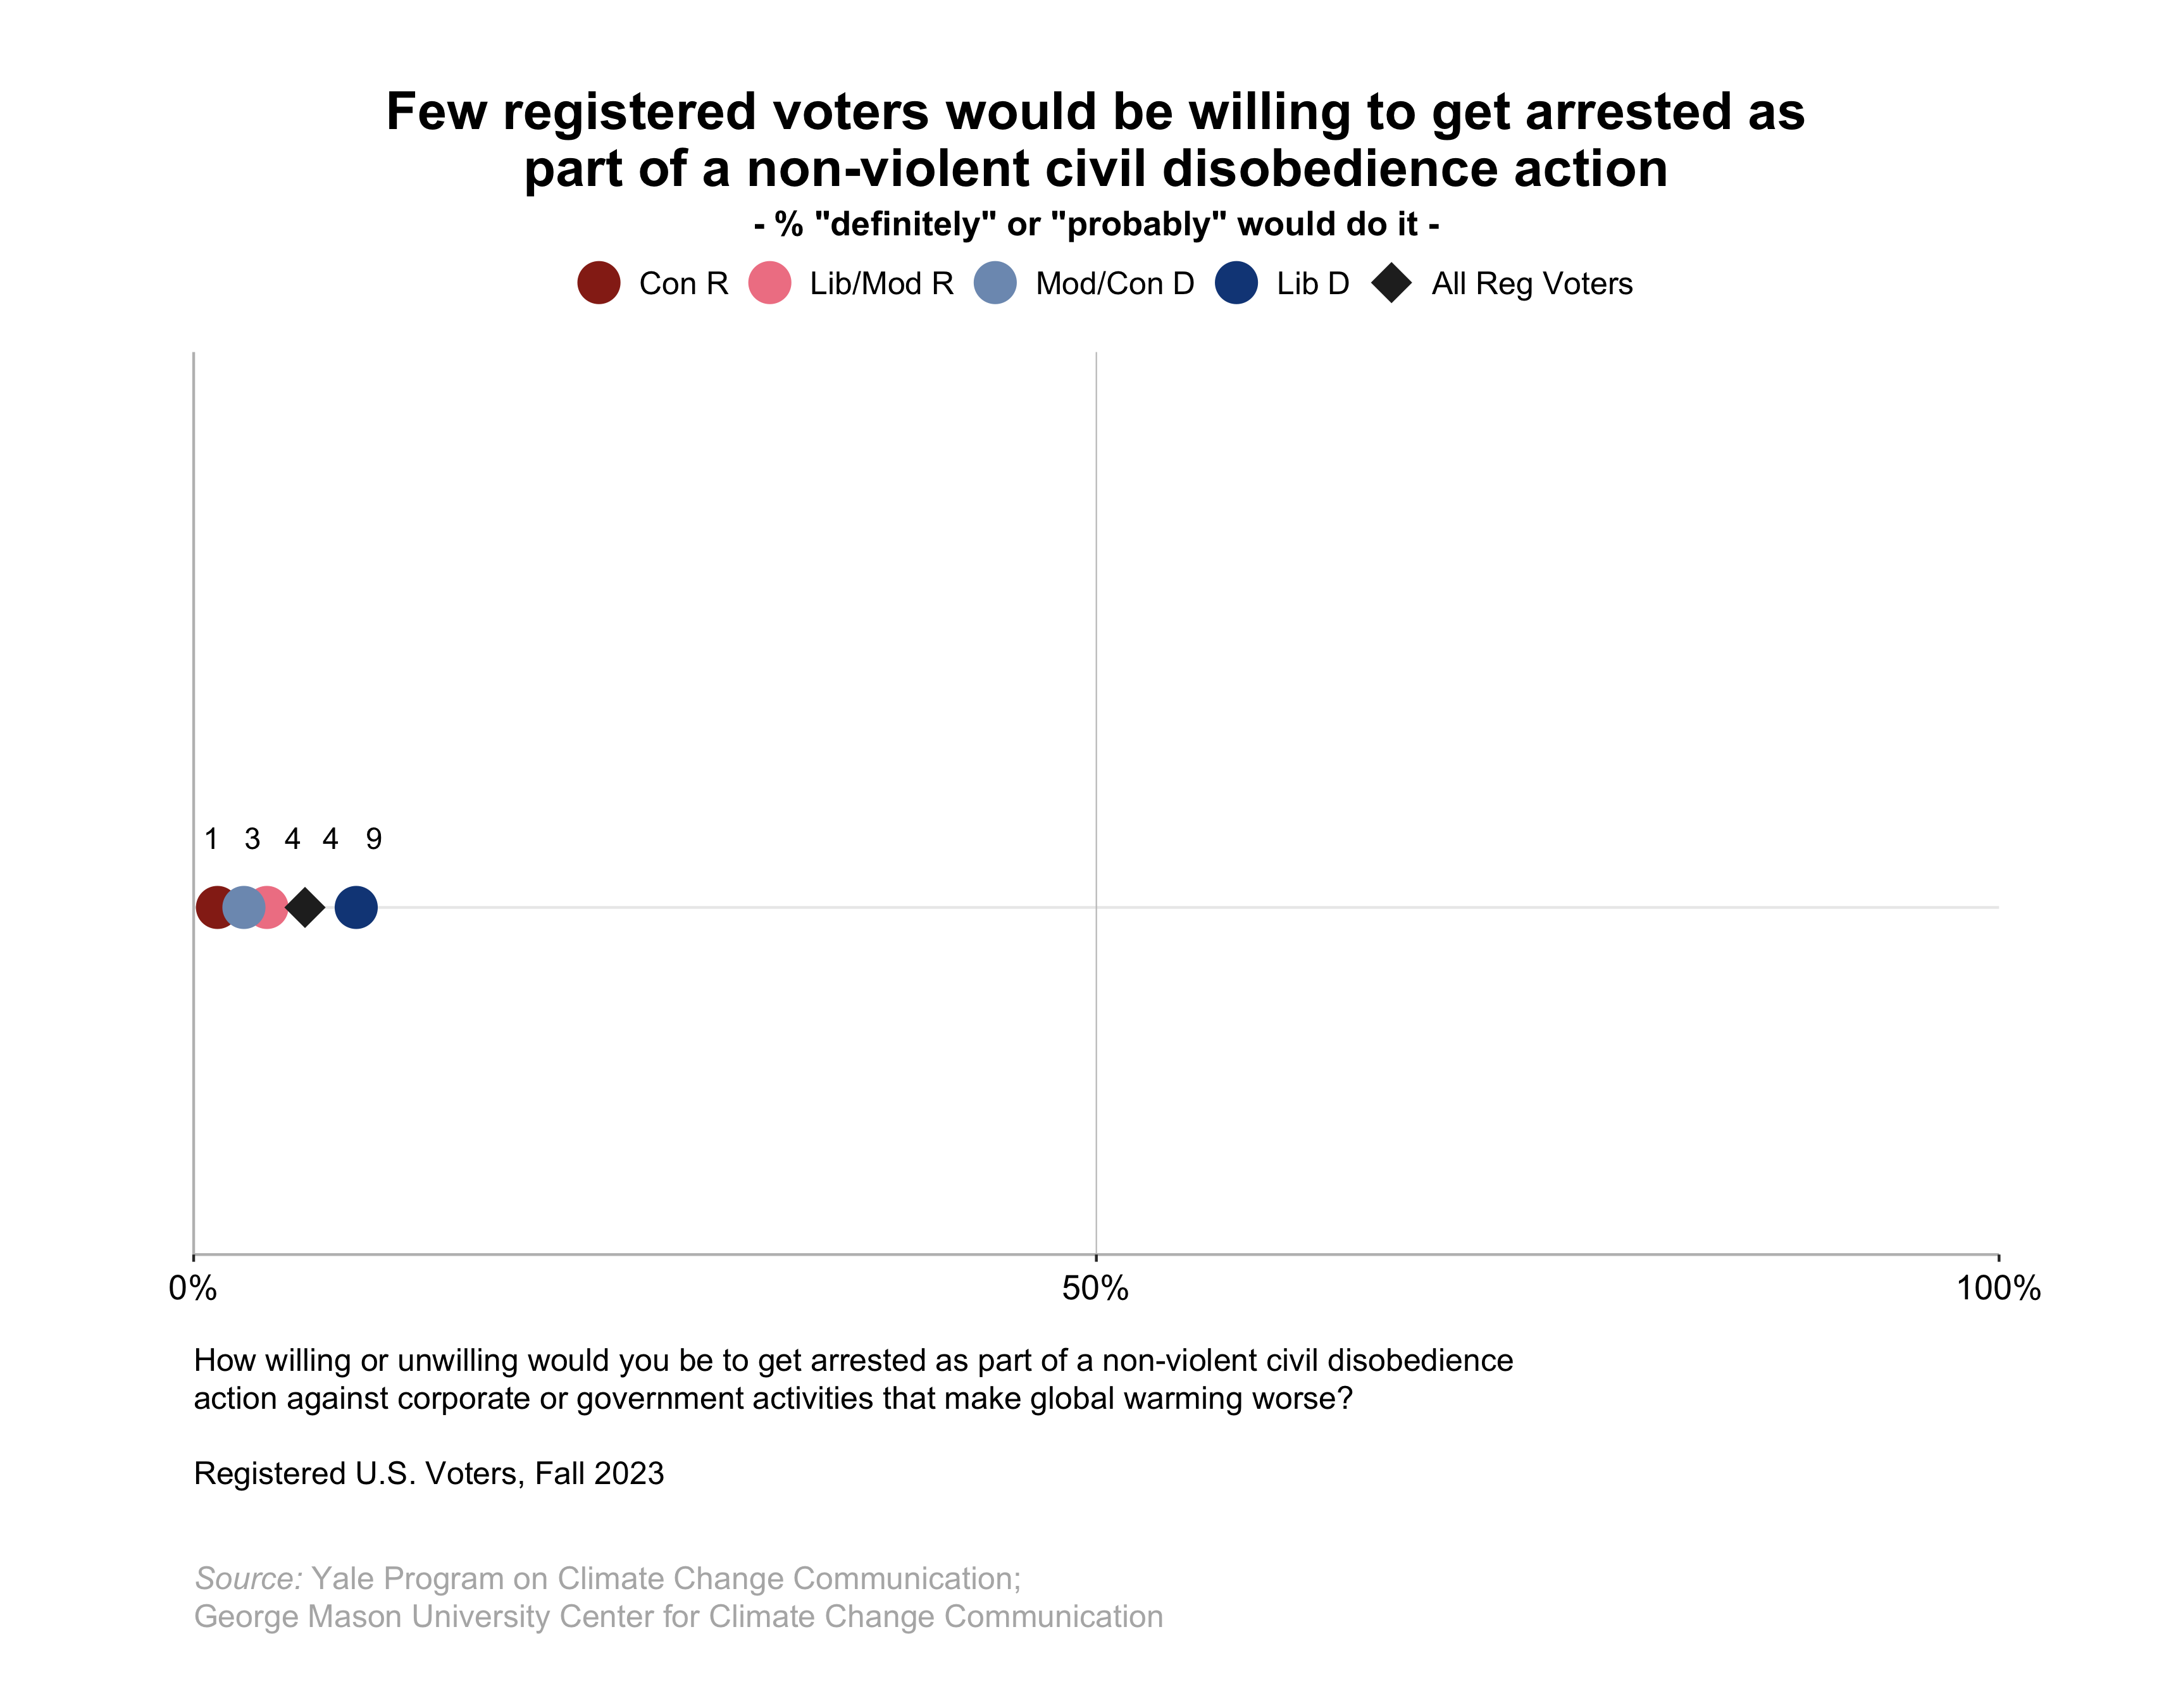
9.4. Few registered voters would be willing to get arrested as part of a non-violent civil disobedience action.
Although 12% of registered voters say they would personally engage in non-violent civil disobedience against corporate or government activities that make global warming worse (refer to section 8.3), only 4% say they would be willing to get arrested as part of such an action (1% “definitely would,” 3% “probably would”; refer to data tables, p. 64). This includes 9% of liberal Democrats, 4% of liberal/moderate Republicans, 3% of moderate/conservative Democrats, and 1% of conservative Republicans.
According to the most recent data available from the U.S. Census Bureau, there are more than 168 million registered voters in the United States. Given that 1% say they “definitely would” get arrested as part of a non-violent action against activities that make global warming worse, and an additional 3% “probably would,” it suggests that approximately 1.5 million to 7 million registered voters may be willing to do so.
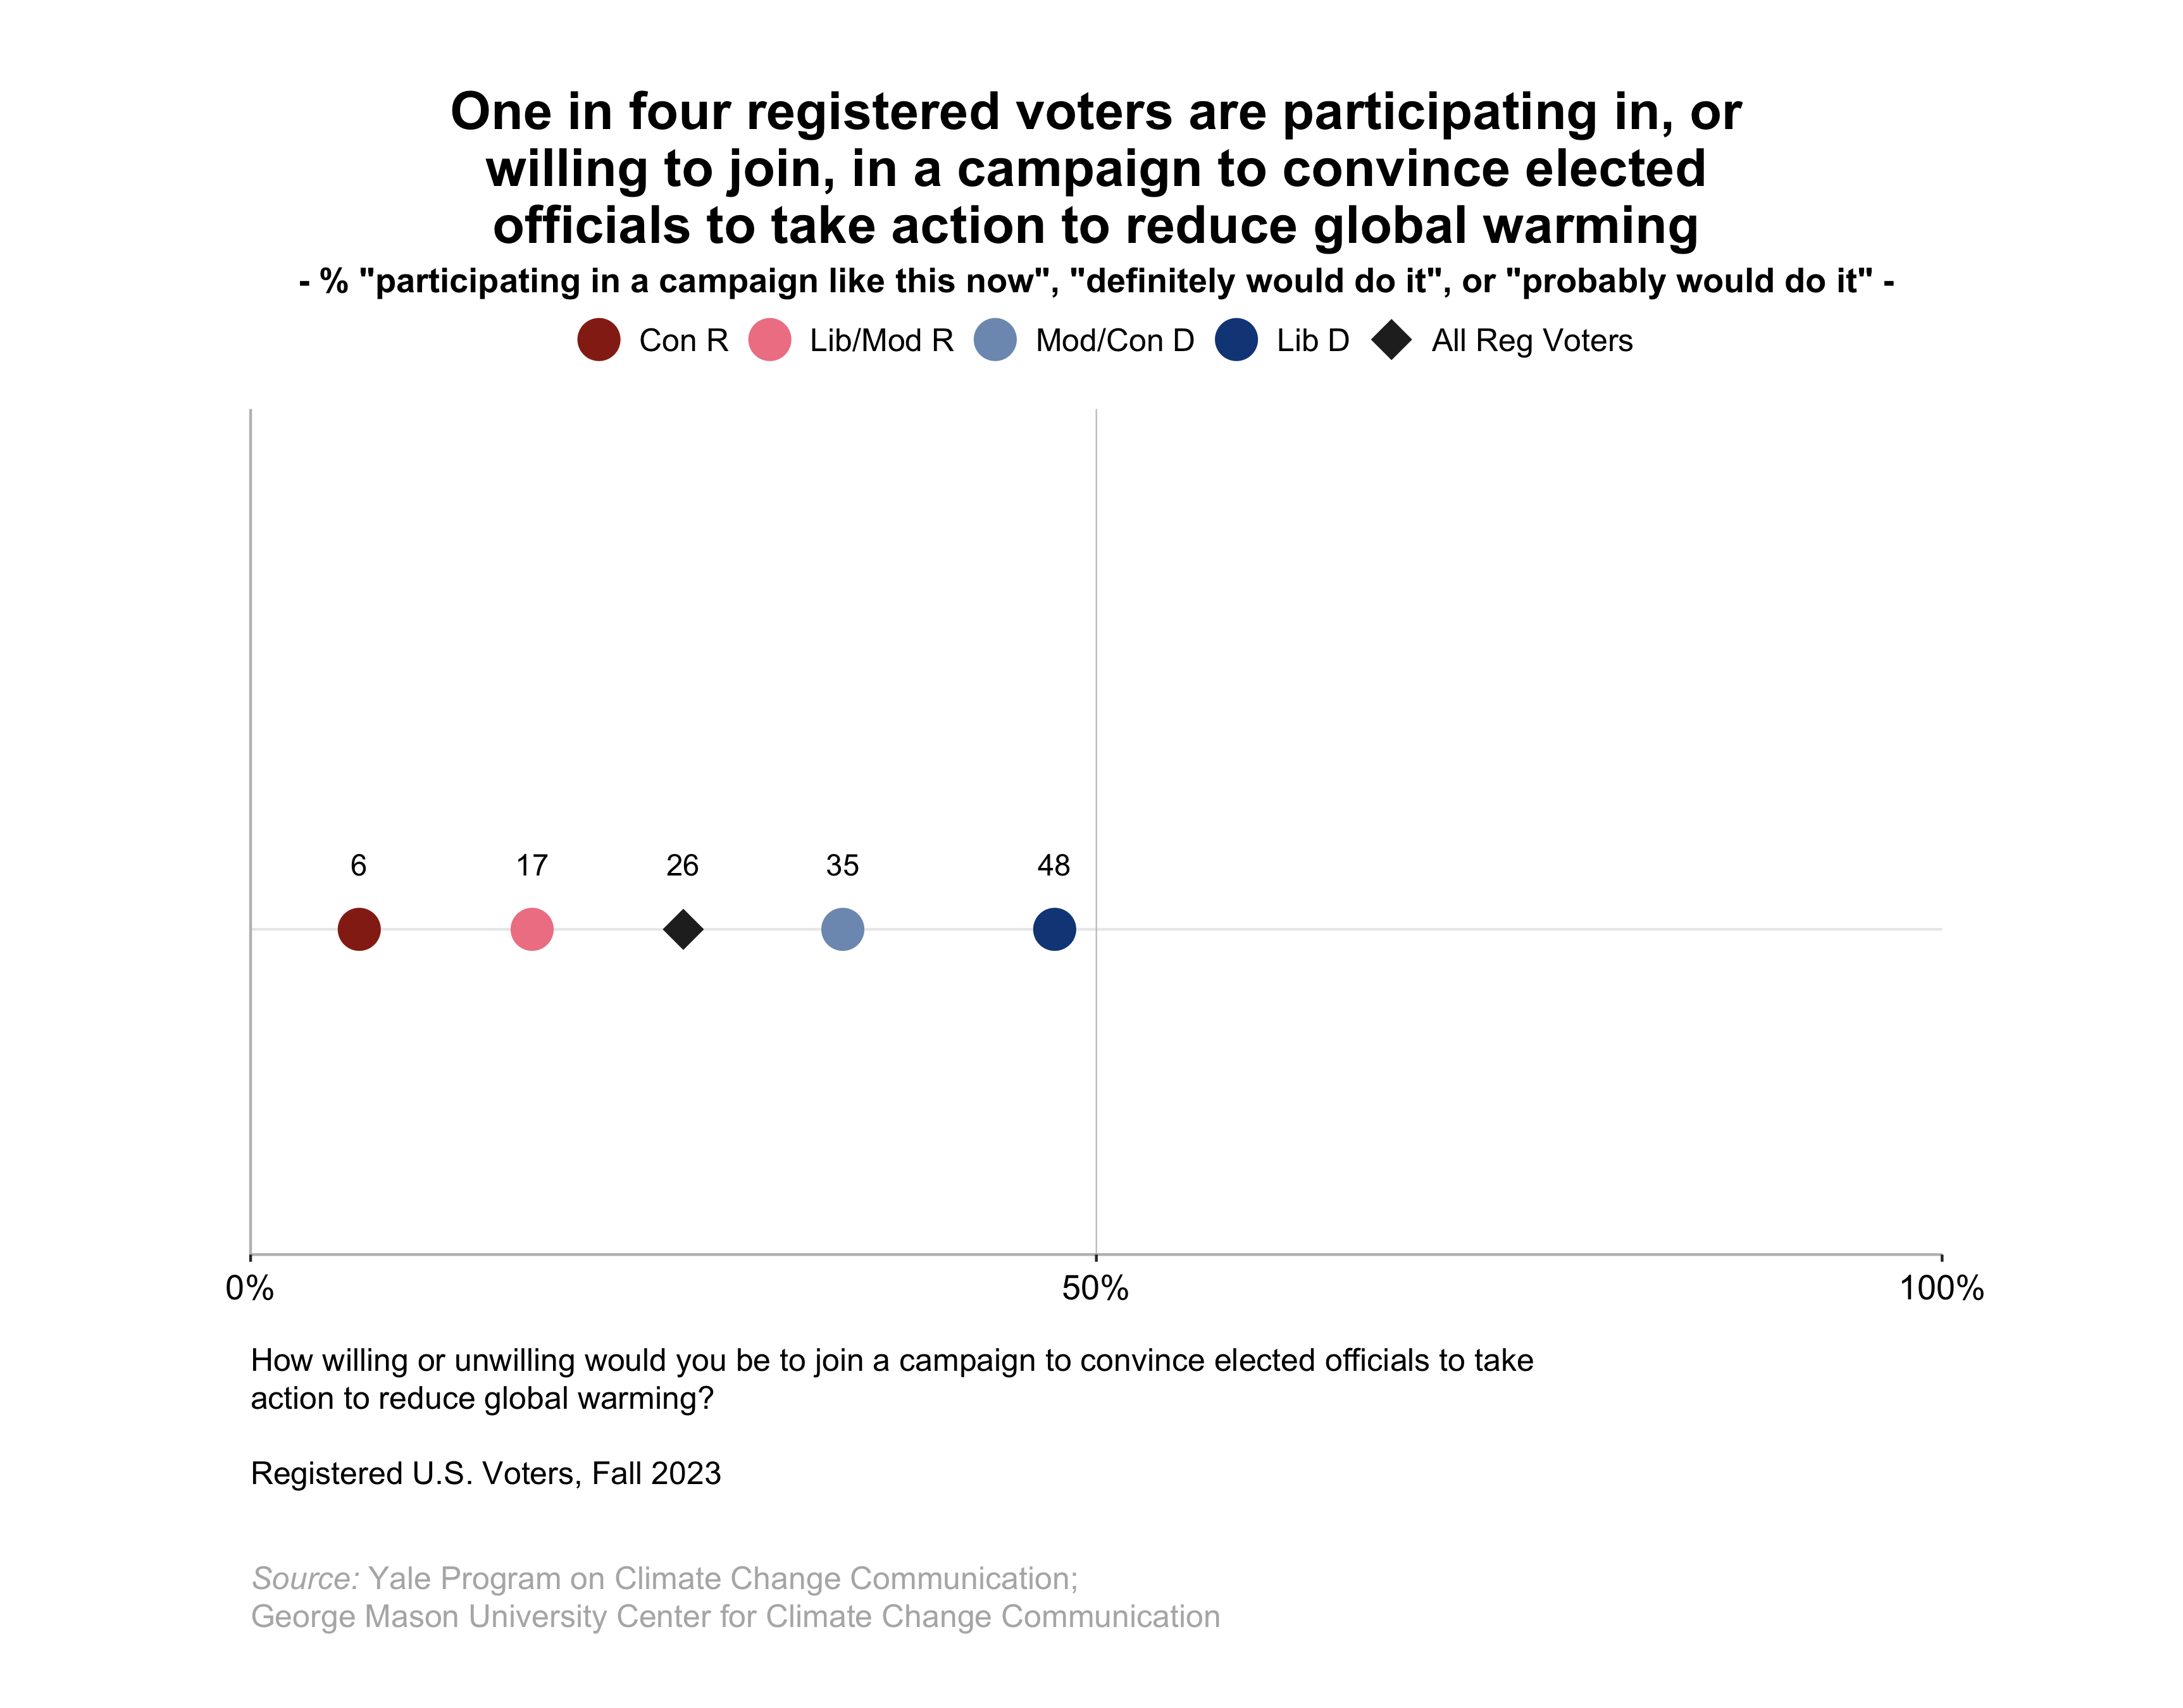
9.5. One in four registered voters are participating, or willing to participate, in a campaign to convince elected officials to take action to reduce global warming – although current participation is low.
One in four in ten registered voters (25%) say they are either “definitely” (6%) or “probably” (18%) willing to join a campaign to convince elected officials to take action to reduce global warming or are currently participating in such a campaign (2%; refer to data tables, p. 65). This includes 48% of liberal Democrats (4% “currently,” 14% “definitely,” 29% “probably”), 35% of moderate/conservative Democrats (less than 1% “currently,” 6% “definitely,” 29% “probably”), 17% of liberal/moderate Republicans (1% “currently,” 2% “definitely,” 13% “probably”), and 6% of conservative Republicans (none “currently,” 2% “definitely,” and 5% “probably”).
10. Consumer Actions to Limit Global Warming
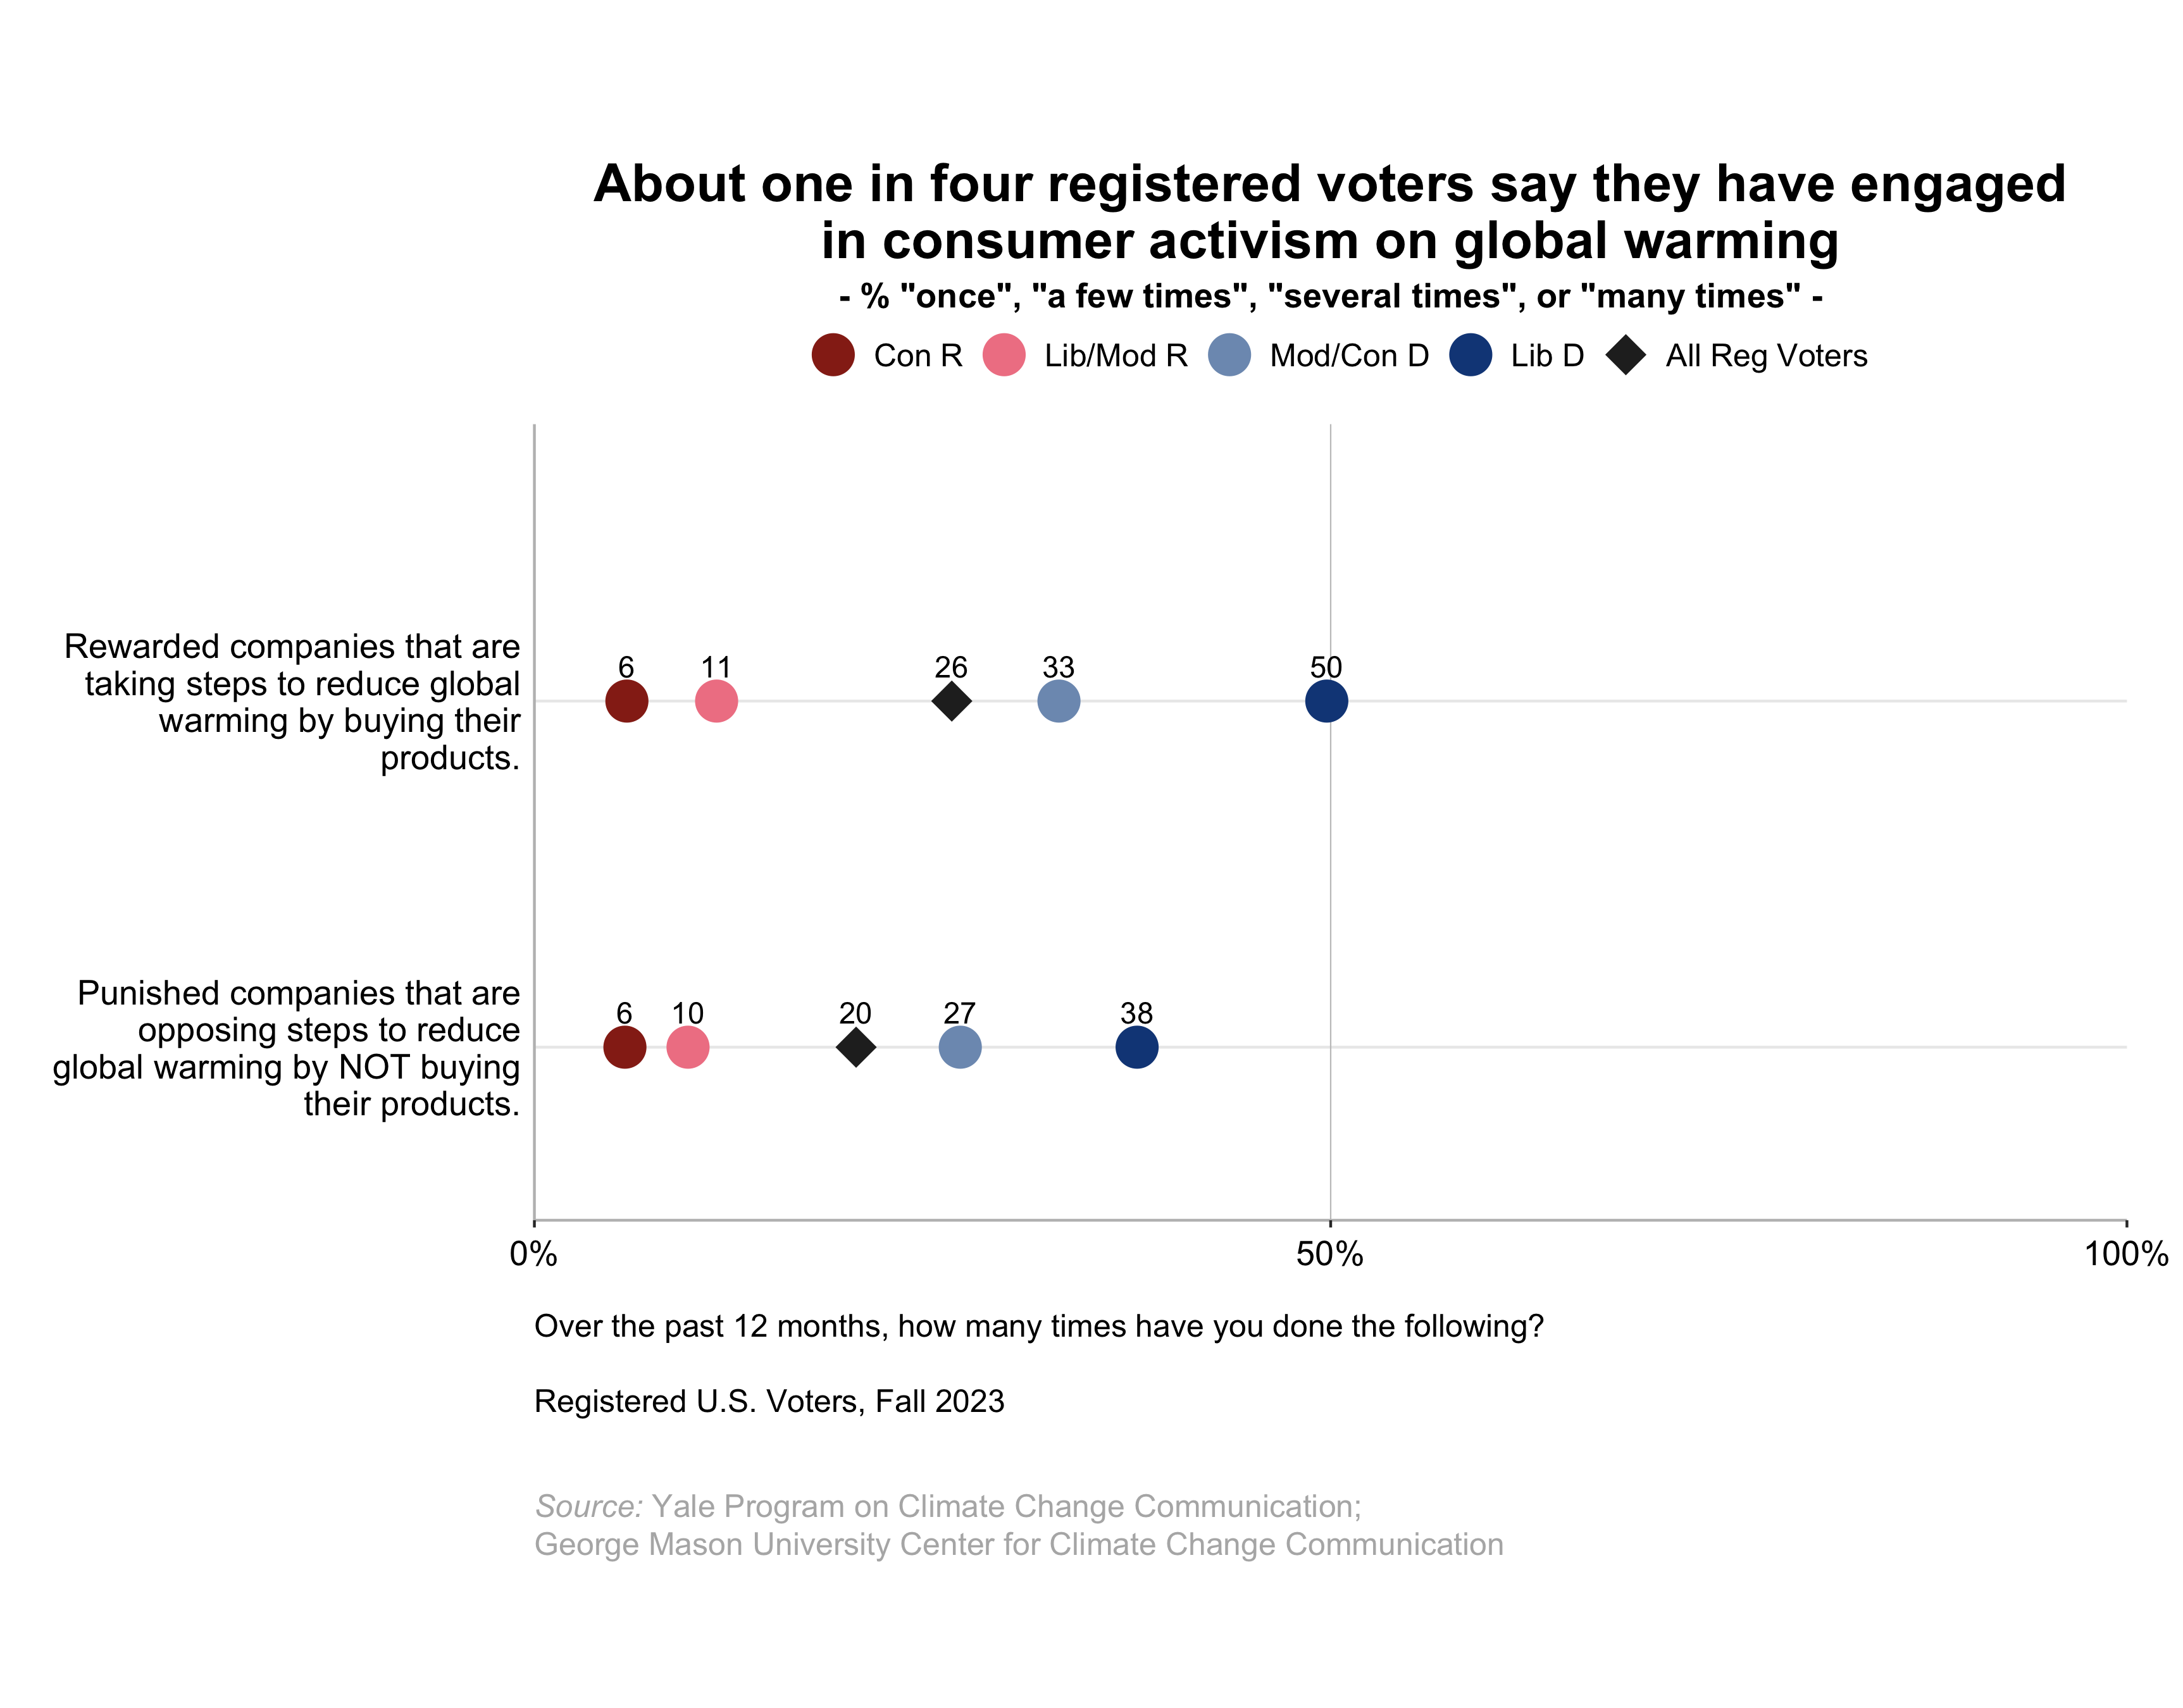
10.1. About one in four registered voters say they have engaged in consumer activism on global warming.
About one in four registered voters (26%) say they have rewarded companies that are taking steps to reduce global warming by buying their products in the past 12 months and one in five (20%) say they have punished companies that are opposing steps to reduce global warming by not buying their products.
Half of liberal Democrats (50%) and one in three moderate/conservative Democrats (33%) say they have rewarded companies in the past 12 months while fewer liberal/moderate Republicans (11%) and conservative Republicans (6%) have done so. Similarly, 38% of liberal Democrats and 27% of moderate/conservative Democrats say they have punished companies in the past 12 months, while fewer liberal/moderate Republicans (10%) and conservative Republicans (6%) have done so.
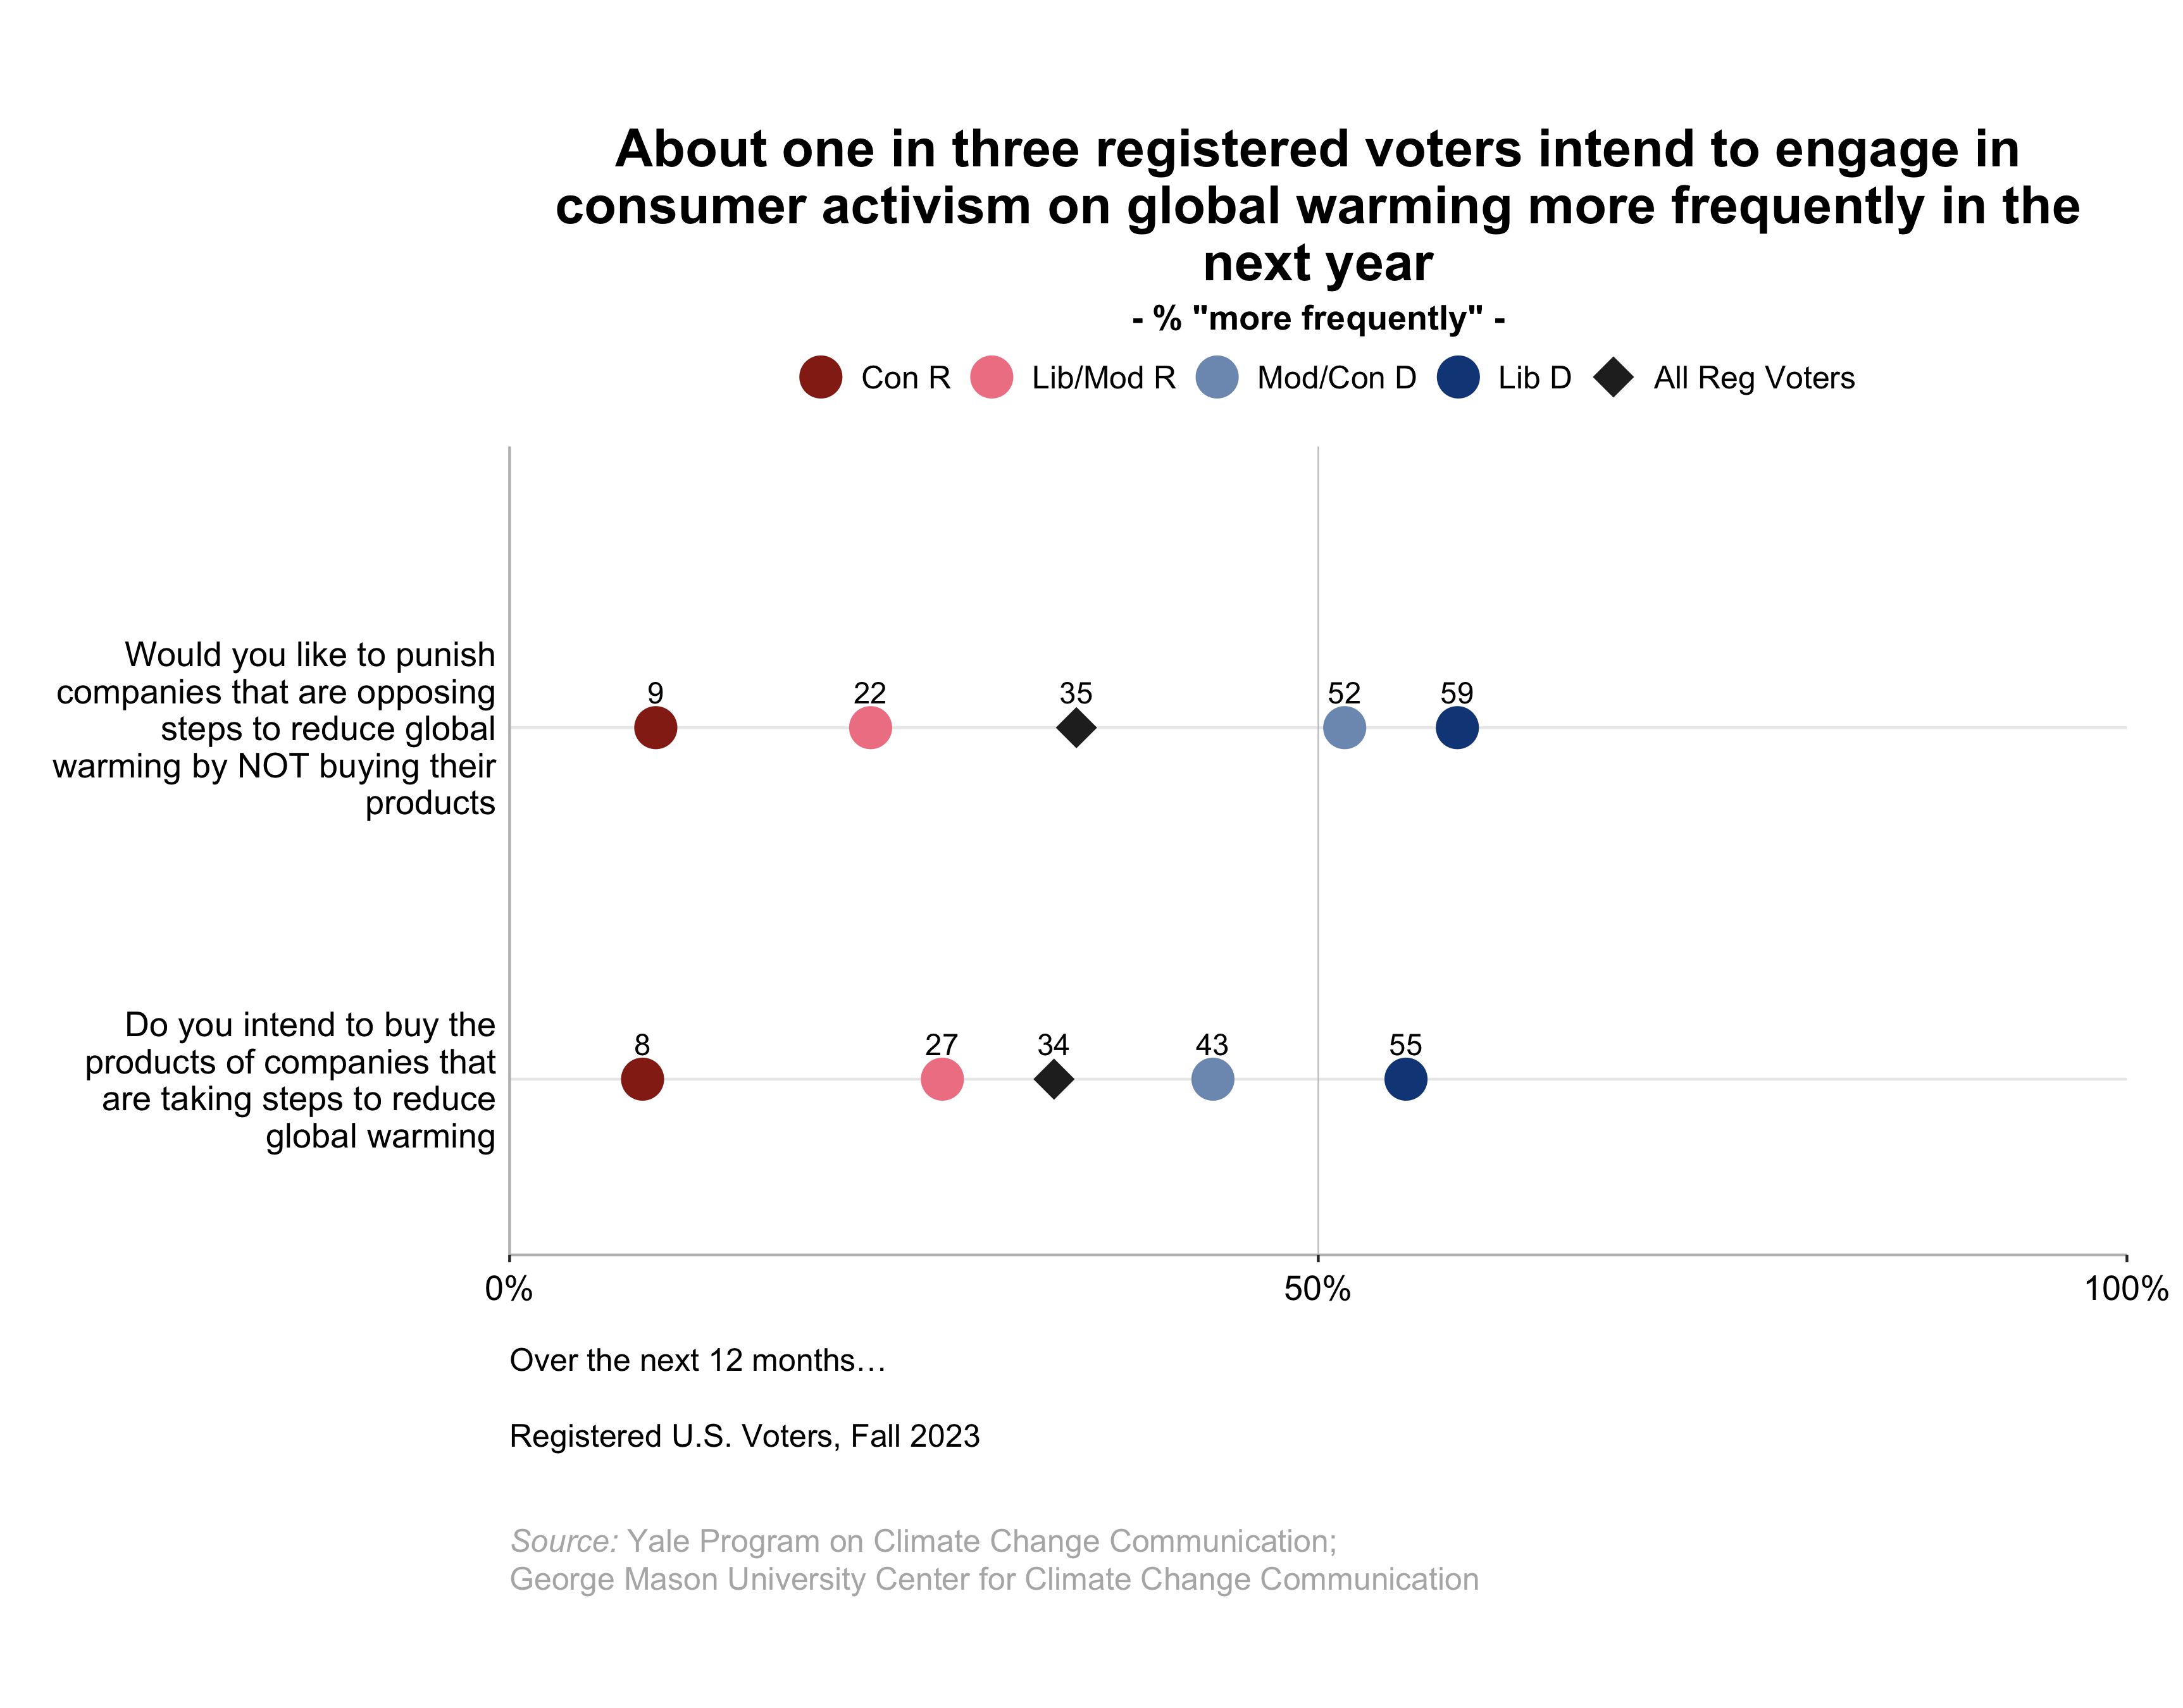
10.2. About one in three registered voters intend to engage in consumer activism on global warming more frequently in the next year.
About one in three registered voters (35%) say that, over the next 12 months, they would like to punish companies that are opposing steps to reduce global warming by not buying their products more frequently than they are now. About the same percentage (34%) say they intend to buy the products of companies that are taking steps to reduce global warming more frequently than they do now.
Majorities of liberal Democrats (59%) and moderate/conservative Democrats (52%) say they would like to punish companies that are opposing steps to reduce global warming more frequently, while 22% of liberal/moderate Republicans and 9% of conservative Republicans say so. A majority of liberal Democrats (55%) as well as 43% of moderate/conservative Democrats and 27% of liberal/moderate Republicans, but only 8% of conservative Republicans say they intend to buy the products of companies that are taking steps to reduce global warming more frequently.
11. Collective Efficacy
11.1. Fewer than half of registered voters are confident they can affect what the federal government and corporations do about global warming.
Perceived collective efficacy regarding global warming – the belief that like-minded citizens can work together to influence what government and business leaders do about global warming – is an important motivator for individuals to take collective action.1 Fewer than half of registered voters (42%) are at least “moderately confident” that people like them, working together, can affect what the federal government does about global warming. Similarly, 40% are at least “moderately confident” that people like them, working together, can affect what corporations do about global warming.
Liberal Democrats have the highest perceptions of collective efficacy regarding global warming, while conservative Republicans have the lowest perceptions of collective efficacy, although that may in part be because they are less likely to support action on global warming overall.
12. Educating Students About Global Warming
12.1. Three in four registered voters say schools should teach children about global warming.
The Next Generation Science Standards for K-12 STEM (Science, Technology, Engineering, and Mathematics) education in the United States recommend that climate change be included in school science curricula.
Three in four registered voters (75%) agree that schools should teach children about the causes and consequences of global warming, and potential solutions. This includes nearly all liberal and moderate/conservative Democrats (97% and 96% respectively), a large majority of liberal/moderate Republicans (73%), and about one in three conservative Republicans (37%).
Appendix I: Data Tables
Data Tables can be found beginning on p. 43 of the PDF version of the report:
Appendix II: Survey Method
The data in this report are based on a nationally representative survey of 1,033 American adults, aged 18 and older. Results are reported for the subset of 906 registered voters who participated in the survey. The survey was conducted October 20 –26, 2023. All questionnaires were self-administered by respondents in a web-based environment. The median completion time for the survey was 22 minutes.
The sample was drawn from the Ipsos KnowledgePanel®, an online panel of members drawn using probability sampling methods. Prospective members are recruited using a combination of random digit dial and address-based sampling techniques that cover virtually all (non-institutional) residential phone numbers and addresses in the United States. Those contacted who would choose to join the panel but do not have access to the Internet are loaned computers and given Internet access so they may participate.
The sample therefore includes a representative cross-section of American adults—irrespective of whether they have Internet access, use only a cell phone, etc. The sample was weighted, post survey, to match key US Census Bureau demographic norms.
From November 2008 to December 2018, no KnowledgePanel® member participated in more than one Climate Change in the American Mind (CCAM) survey. Beginning with the April 2019 survey, panel members who have participated in CCAM surveys in the past, excluding the most recent two surveys, may be randomly selected for participation. In the current survey, 276 respondents, 243 of whom are registered voters included in this report, participated in a previous CCAM survey.
The survey instrument was designed by Anthony Leiserowitz, Seth Rosenthal, Jennifer Carman, Marija Verner, Matthew Ballew, Sanguk Lee, Matthew Goldberg, and Jennifer Marlon of Yale University, and Edward Maibach, John Kotcher, Teresa Myers, Nicholas Badullovich, and Kathryn Thier of George Mason University. The figures and tables were constructed by Emily Goddard of Yale University.
Margins of error
All samples are subject to some degree of sampling error—that is, statistical results obtained from a sample can be expected to differ somewhat from results that would be obtained if every member of the target population was interviewed. Average margins of error, at the 95% confidence level, are as follows:
• All Registered Voters (n = 906): Plus or minus 3 percentage points.
• Democrats (total; n = 394): Plus or minus 5 percentage points.
• Liberal Democrats (n = 238): Plus or minus 6 percentage points.
• Moderate/conservative Democrats (n = 156): Plus or minus 8 percentage points.
• Independents (n = 104): Plus or minus 10 percentage points.
• Republicans (total; n = 370): Plus or minus 5 percentage points.
• Liberal/moderate Republicans (n = 114): Plus or minus 9 percentage points.
• Conservative Republicans (n = 255): Plus or minus 6 percentage points.
Rounding error and tabulation
In data tables, bases specified are unweighted, while percentages are weighted to match national population parameters.
For tabulation purposes, percentage points are rounded to the nearest whole number. As a result, percentages in a given chart may total slightly higher or lower than 100%. Summed response categories (e.g., “strongly support” + “somewhat support”) are rounded after sums are calculated. For example, in some cases, the sum of 25% + 25% might be reported as 51% (e.g., 25.3% + 25.3% = 50.6%, which, after rounding, would be reported as 25% + 25% = 51%).
Appendix III: Sample Demographics
Sample demographics can be found on p. 69 of the PDF version of the report:
Citation
Leiserowitz, A., Maibach, E., Rosenthal, S., Kotcher, J., Goddard, E., Carman, J., Verner, M., Ballew, M., Marlon, J., Lee, S., Myers, T., Goldberg, M., Badullovich, N., Thier, K. (2023). Climate Change in the American Mind: Politics & Policy, Fall 2023. Yale University and George Mason University. New Haven, CT: Yale Program on Climate Change Communication.
Funding Sources
The research was funded by the 11th Hour Project, the Energy Foundation, the MacArthur Foundation, the Heising-Simons Foundation, King Philanthropies, and the Grantham Foundation.